Figure 4.
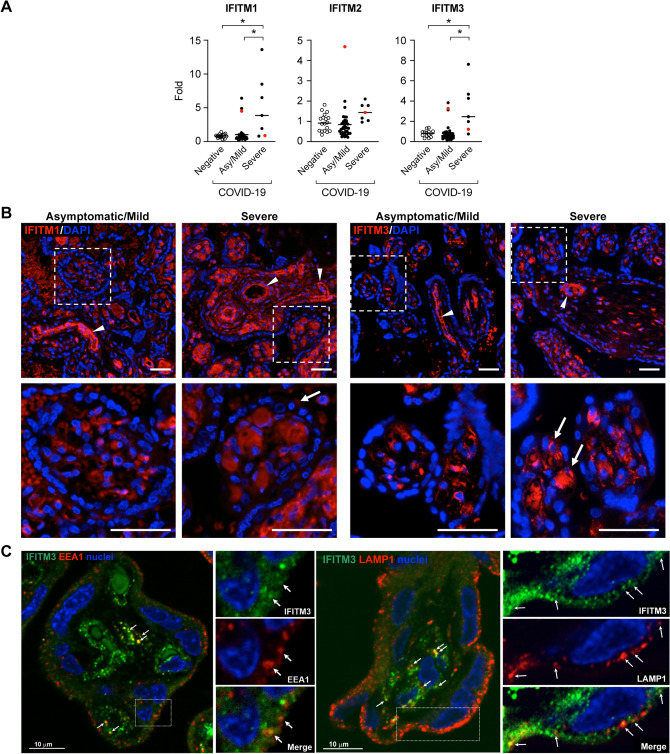
Placental expression of antiviral IFITM proteins. (A) Placental expression of IFITM1–3 mRNAs. Analysis, stratified by disease severity (asymptomatic/mild vs severe) and negative controls, was performed using RT-qPCR as detailed in “Methods”. The red dot denotes SARS-CoV-2-positive placenta. The data were analyzed using Kruskal–Wallis nonparametric test, with post hoc Tukey test for all pairwise comparisons. *Denotes p < 0.01. (B) Placental sections from participants with asymptomatic/mild vs severe COVID disease, stained for either IFITIM1 or IFITM3 immunofluorescence as described in “Methods”, and nuclei visualized with DAPI. Boxed areas are enlarged below. White arrowheads mark positive fetal stem villous vessels. White arrows mark rare less frequent trophoblast staining in terminal villi. Scale Bars: 50 µm. Negative-control immunofluorescence stains are shown in Supplementary Fig. 1. (C) Placental sections from negative-control term placentas, stained for IFITM3 immunofluorescence (green) and co-stained for either EEA1, a marker of early endosome, or LAMP1, a marker of late endosome/lysosome, as described in “Methods”. Nuclei were visualized with DAPI. Boxed areas are enlarged to the right side of each image. White arrowheads denote colocalization of IFITM3 and endosomal markers. Scale Bar: 10 µm.

