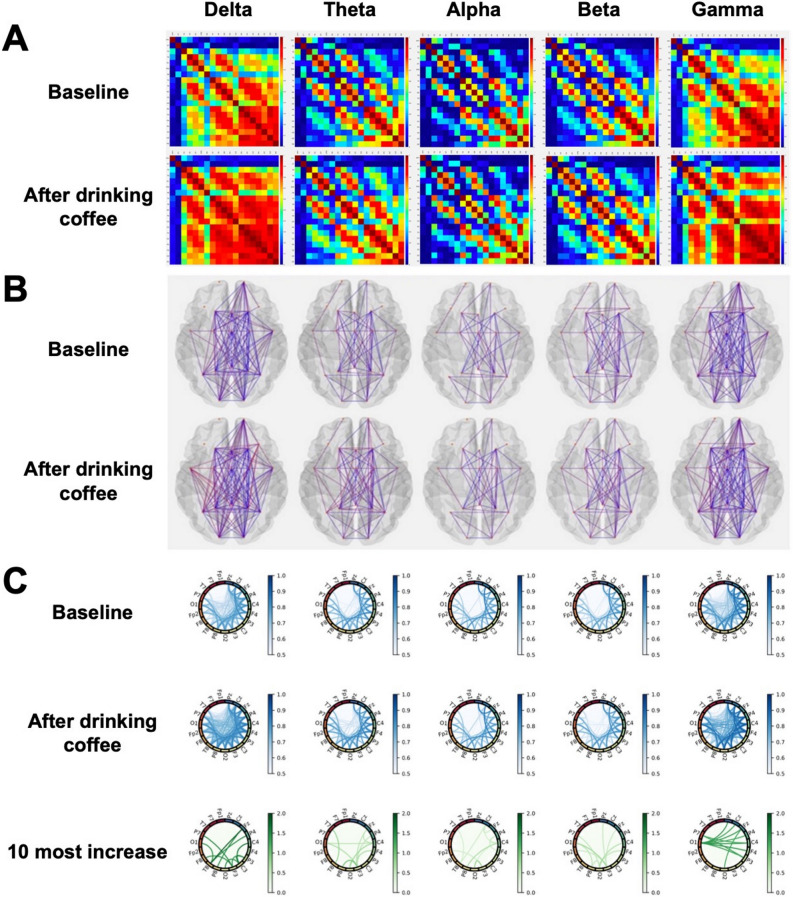
Figure 3.
Coherence averaged across all subjects. (A) The plots show the coherence between 19 pairs of scalp electroencephalography electrodes in each frequency band at baseline (upper) and after coffee consumption (low). (B) Brain topologies of functional connectivity at baseline (upper) and after coffee consumption (low) are presented. (C) Each column corresponds to a frequency band as indicated on the top of the figure. Coherence matrices corresponding to the resting-state EEG before and after coffee consumption are plotted on the first and second rows, respectively; to avoid confusion from too many lines, those of coherence less than 0.5 are not shown. The third row displays the top 10 most increased lines.

