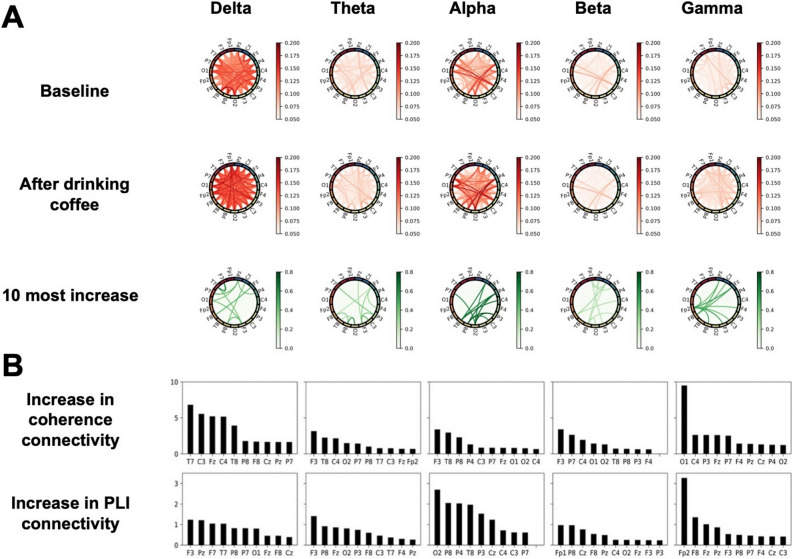
Figure 4.
Phase lag index (PLI) averaged across all subjects and ten most highly increased nodes in each band. (A) Each column corresponds to a frequency band as indicated on the top of the figure. PLI matrices corresponding to the resting-state EEG before and after coffee consumption are plotted on the first and second rows, respectively; lines that have PLI values under 0.05 are not displayed. The third row plots the top 10 most increased lines. (B) The ten channels (nodes) with the highest increase in connectivity in terms of coherence (top row) and PLI (bottom row) are shown for each frequency band (corresponding to each column). Node connectivity was determined by taking the ten most highly increased links after coffee consumption from the averaged functional connectivity matrix (as in the third rows of Figs. 3C and A) and summing the weights of those edges connected to each node.

