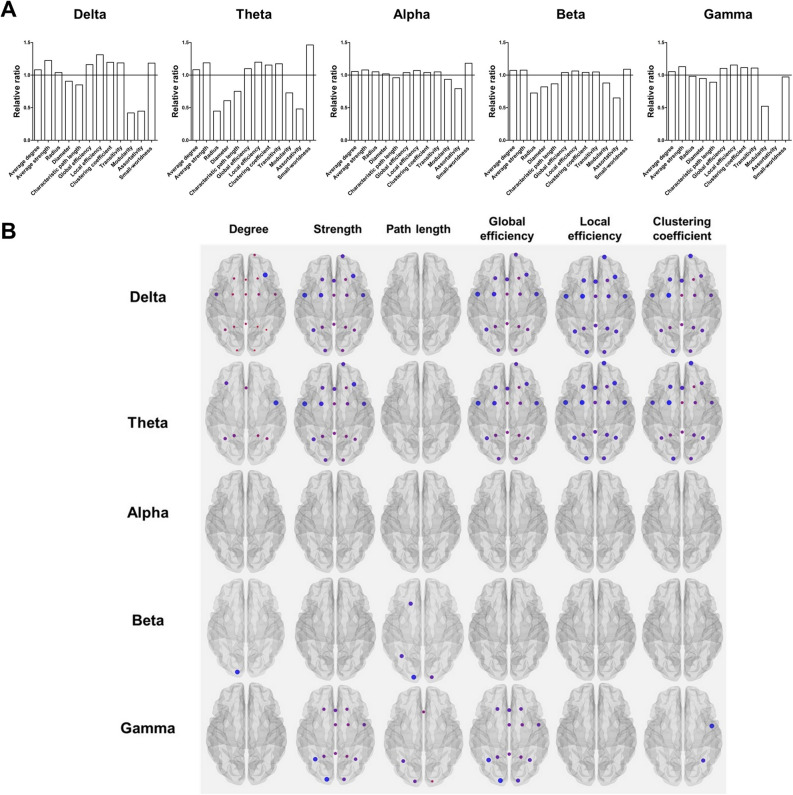
Figure 5.
Results of graph-theoretic analyses and correlation analysis. (A) By setting the values of graph measures at baseline to 1.0 (shown as a line at the value of 1.0), the relative ratio of global graph measures after coffee consumption are presented. (B) Changes after coffee consumption in the nodal measures of graph-theoretic analyses are presented (FDR-corrected P < 0.05). Larger nodes indicate greater differences between the conditions. The regions showing higher significance of differences are colored red, whereas the regions showing lower significance of difference are colored blue.

