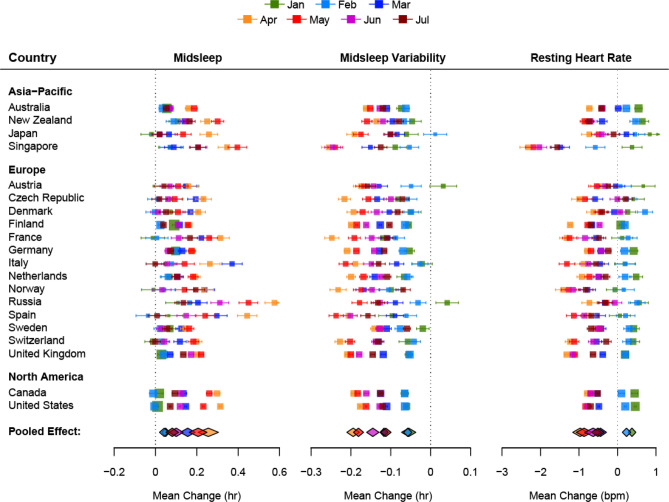
Figure 2.
Forest plots of the average change in midsleep time, midsleep variability and resting heart rate by month and country. The size of the colored squares is proportional to the sample size of each country while whiskers indicate the mean and 95% confidence interval of the estimated difference between 2020 and 2019 by month (Jan–Jul). The overall pooled effect across countries for each month is represented by the colored diamonds below each plot.

