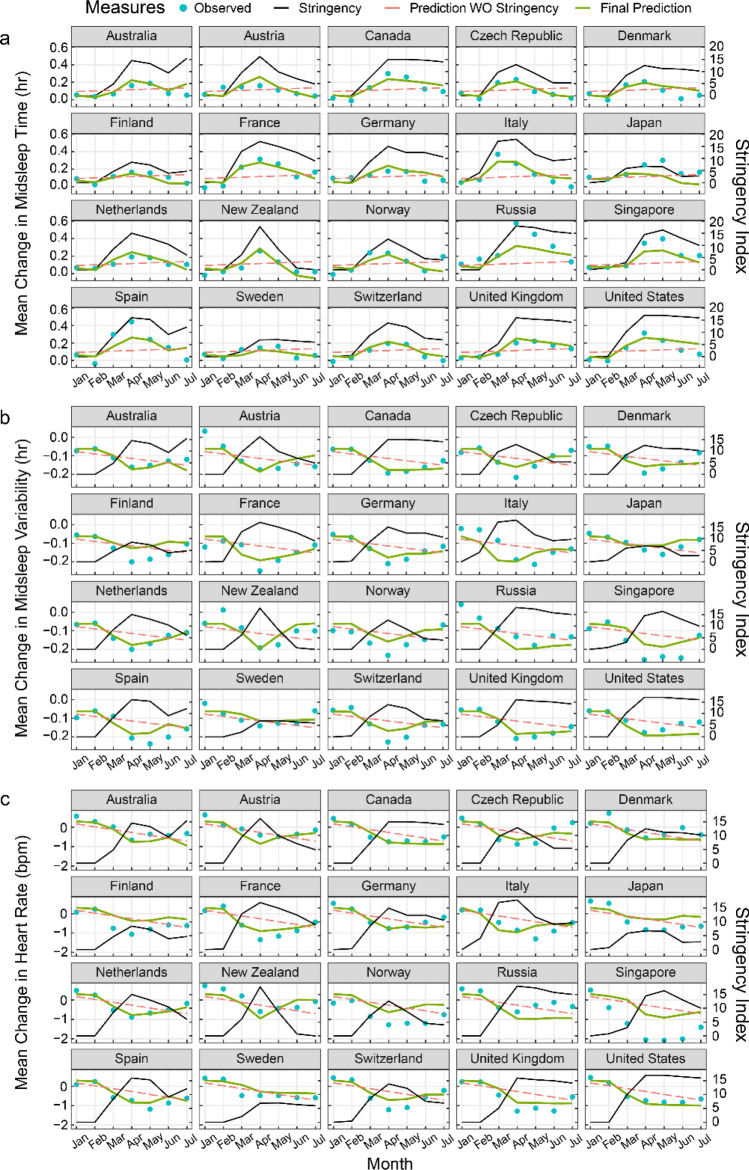
Figure 3.
Prediction of changes in sleep patterns and resting heart rate by lockdown stringency. Plots for fitted models (green curves) across 20 countries estimating changes in (a) midsleep time, (b) midsleep variability and (c) resting heart rate using lockdown stringency as a predictor. Observed mean differences between 2020 and 2019 (blue dots), lockdown stringency (black line) and predictions without (WO) lockdown stringency in the model (red dashed line) are also shown for comparison.

