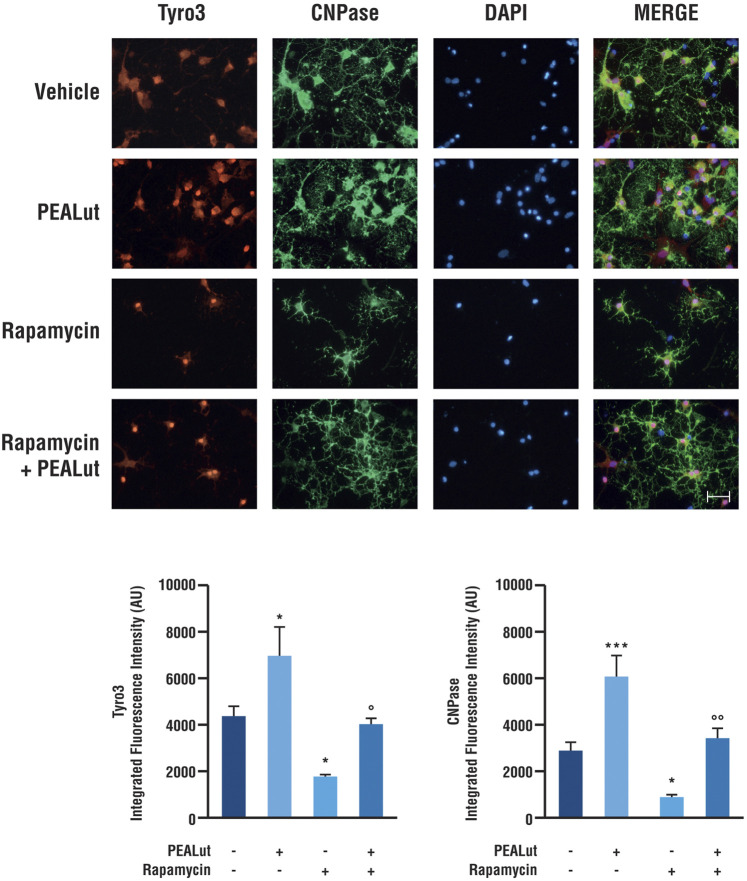
FIGURE 3.
Tyro3 and CNPase immunostaining in OPCs at DIV 8. Cultures of OPCs were treated PEALut at DIV 2 and processed at DIV 8 for immunofluorescence analysis. Rapamycin was added 30 min before PEALut. Scale bar, 20 μm. Graphs show the quantitative analysis of the integrated intensity of fluorescence. Data are expressed as mean ± SEM. Tyro3: *p < 0.05 vs Vehicle; °p < 0.05 vs PEALut. CNPase: *p < 0.05 vs Vehicle; ***p < 0.001 vs Vehicle; °°p < 0.005 vs PEALut.

