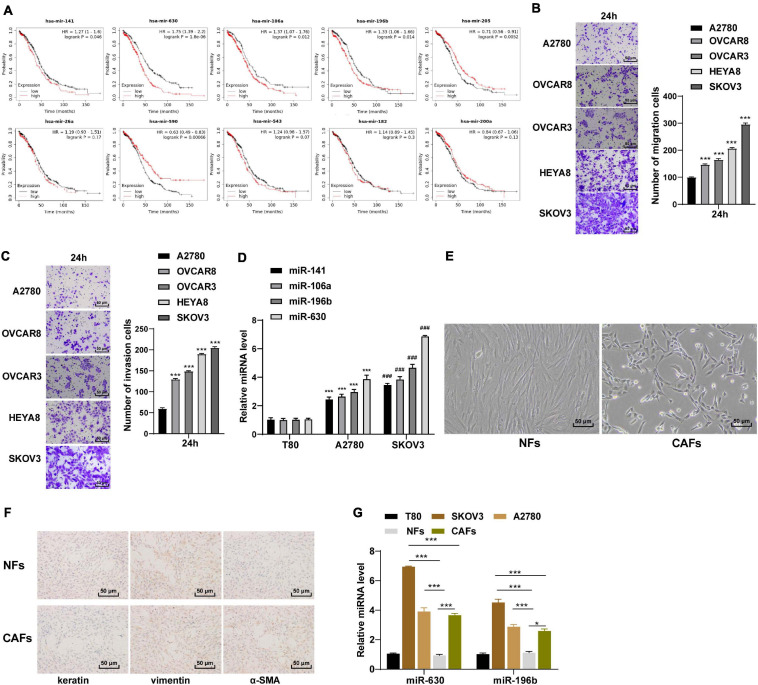
FIGURE 1.
miR-630 was upregulated in OC. (A) Relationship between miRs and prognosis of OC was analyzed by Kaplan–Meier Plotter database; (B,C) OC cells with high metastasis and low metastasis were screened using Transwell assay; (D) Expressions of miR-141, miR-630, miR-106a, and miR-196b in SKOV3 and A2780 cells were detected using RT-qPCR; (E) morphology of NFs and CAFs was observed under the inverted phase contrast microscope; (F) levels of Vimentin, Cytokeratin and α-SMA in NFs and CAFs were detected using immunocytochemistry; (G) expressions of miR-630 and miR-196b in NFs and CAFs were detected using RT-qPCR. The experiment was repeated three times independently. Data are presented as mean ± standard deviation. Data in panels (B,C,D,G) were analyzed using one-way ANOVA, followed by Tukey’s multiple comparison test, ***p < 0.001, ###p < 0.001.

