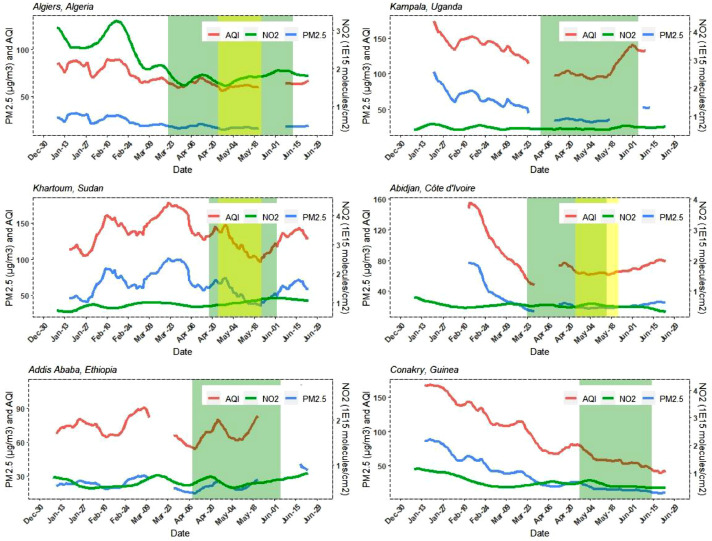
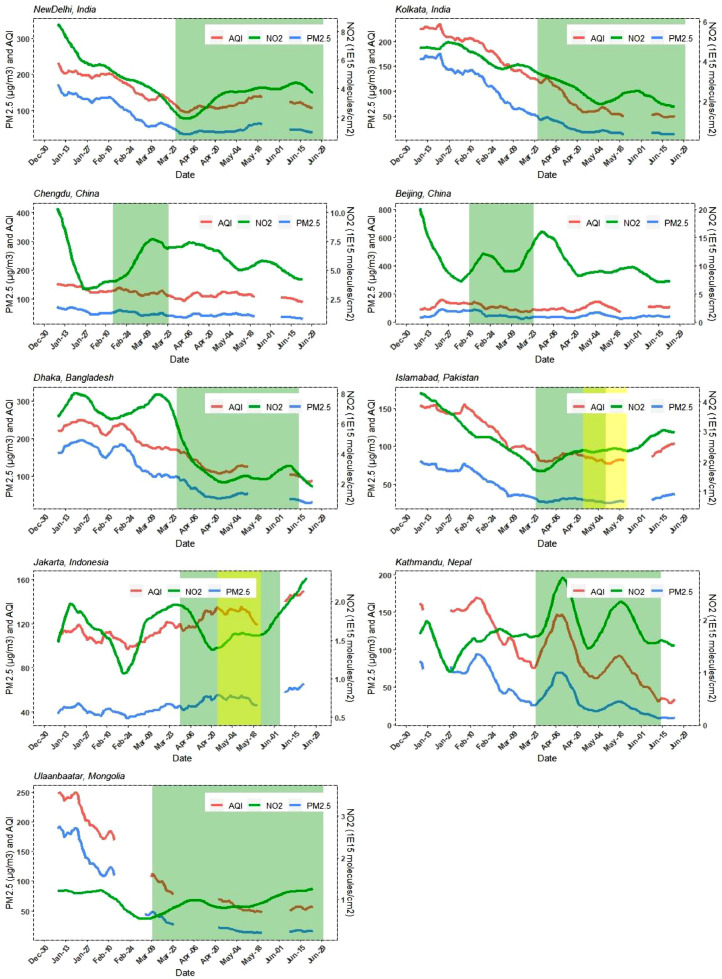
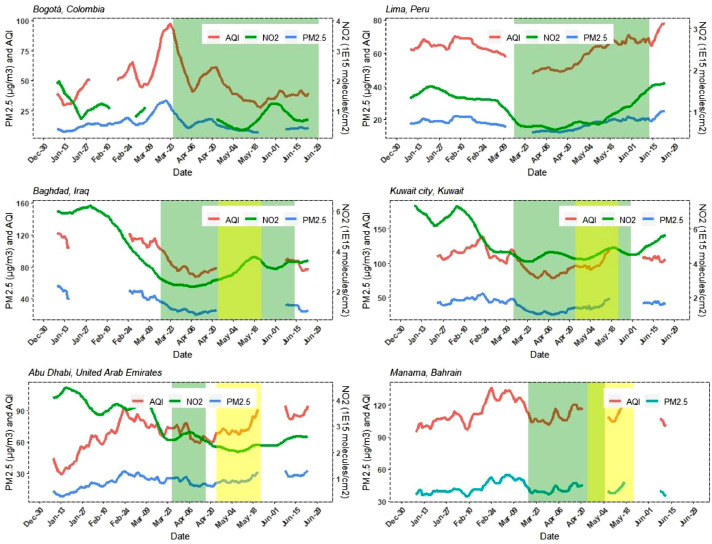
Fig. 6.
Time series of daily AQI, and 15-days moving average concentrations of NO2 (1E15 molecules/cm2) and PM2.5 (µg/m3) from January 1 to June 30, 2020, in 21 cities across the globe. PM2.5 concentrations and AQI are given on the right y-axis and NO2 concentrations on the left y-axis. In green color are represented NO2 concentrations, in blue the PM2.5 concentrations, and in red the AQI values. The green hatched area stands for the lockdown phase and the yellow for the Ramadan period (only for Islamic cities).


