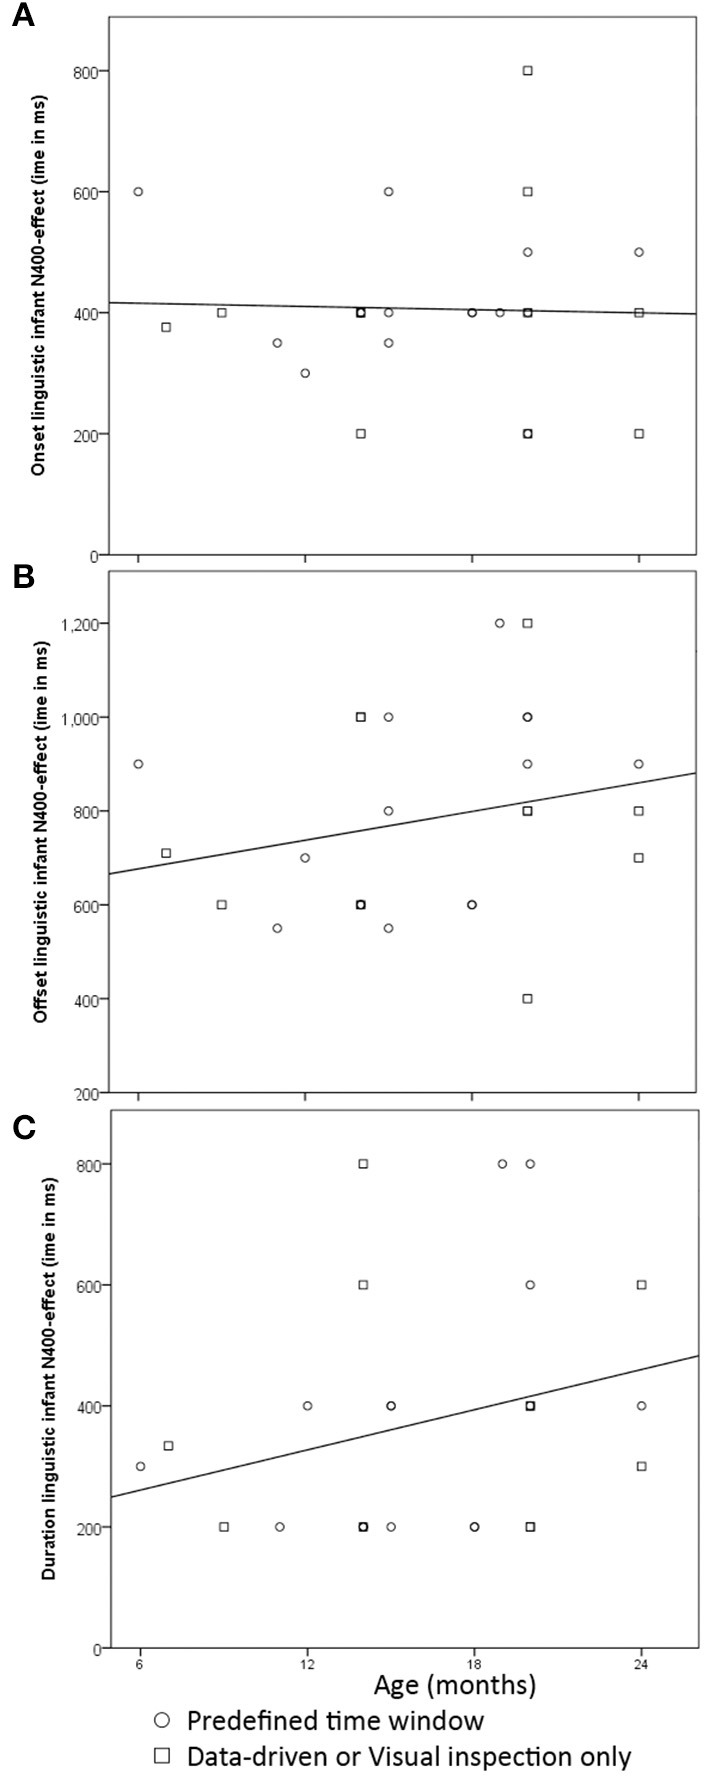
Figure 2.

Scatterplots with the time window for the N400 as a function of infant participants' ages in months: (A)—onset; (B)—offset; (C)—duration of the time window all in ms.

Scatterplots with the time window for the N400 as a function of infant participants' ages in months: (A)—onset; (B)—offset; (C)—duration of the time window all in ms.