
Figure 2.
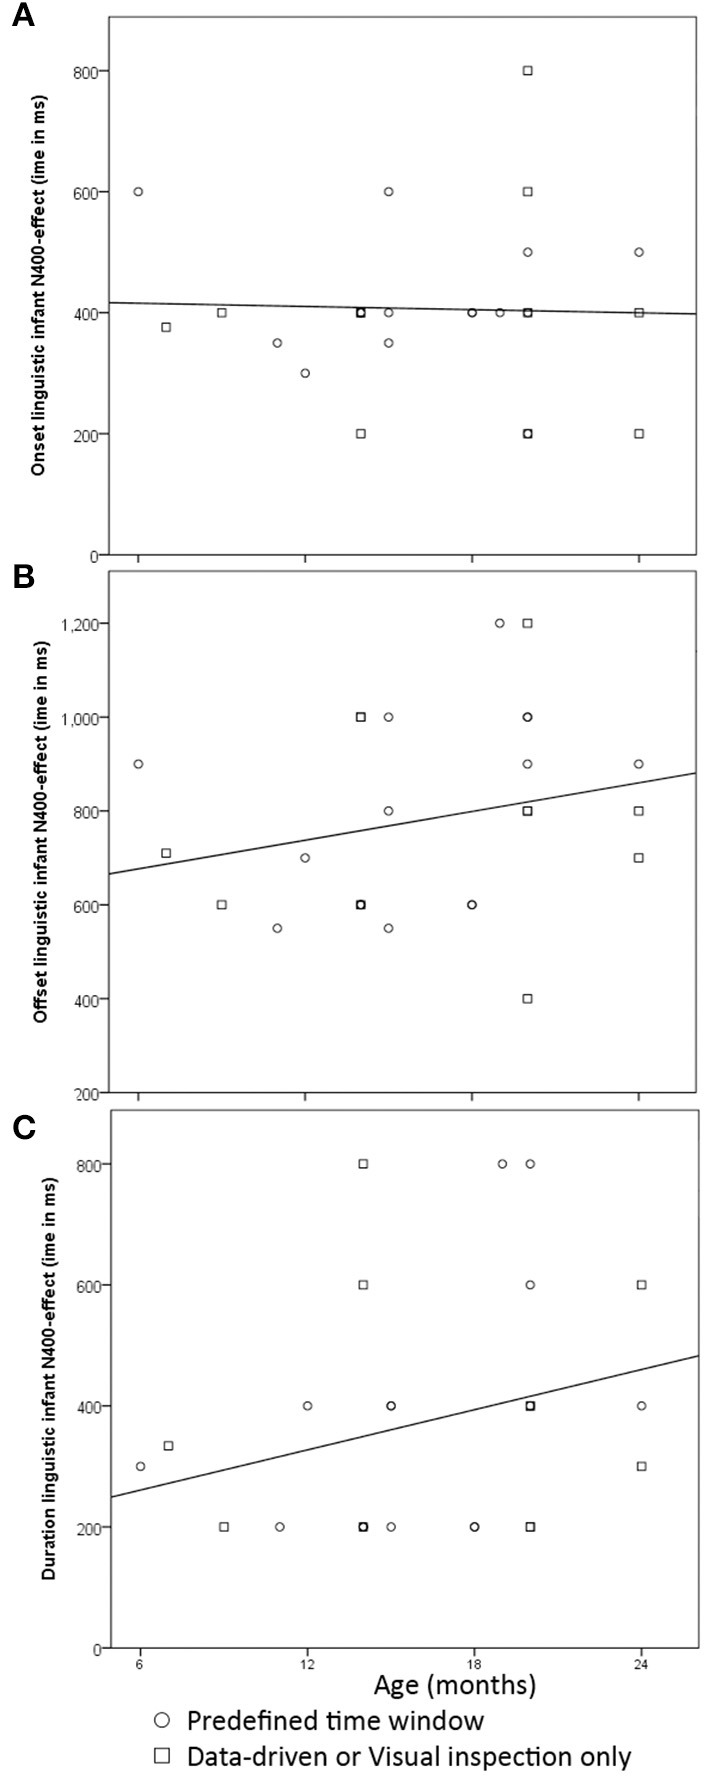
Scatterplots with the time window for the N400 as a function of infant participants' ages in months: (A)—onset; (B)—offset; (C)—duration of the time window all in ms.
Official websites use .gov
A
.gov website belongs to an official
government organization in the United States.
Secure .gov websites use HTTPS
A lock (
) or https:// means you've safely
connected to the .gov website. Share sensitive
information only on official, secure websites.
Scatterplots with the time window for the N400 as a function of infant participants' ages in months: (A)—onset; (B)—offset; (C)—duration of the time window all in ms.