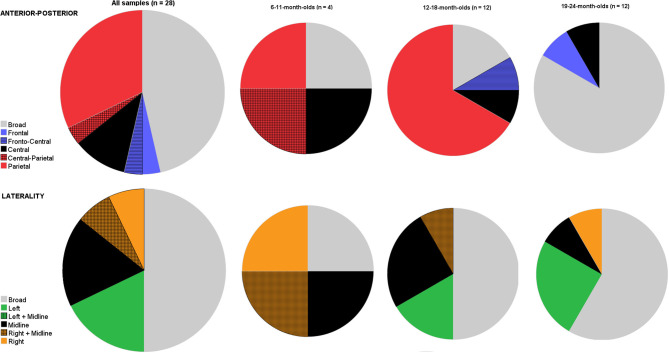
Figure 3.
Pie charts depicting the variation in studies on where on the scalp it is that the N400 priming effect is present (top row: anterior-posterior axis; bottom row: lateral axis) shown for all 28 visual object-word priming studies (age: 6–24-month-olds), and subdivided into three smaller age bins (6–11-month-olds; 12–18-month-olds; 19–24-month-olds). For both axes, there is also a broad category possible, indicating that there is no statistical evidence that the N400 is differently distributed across this axis.

