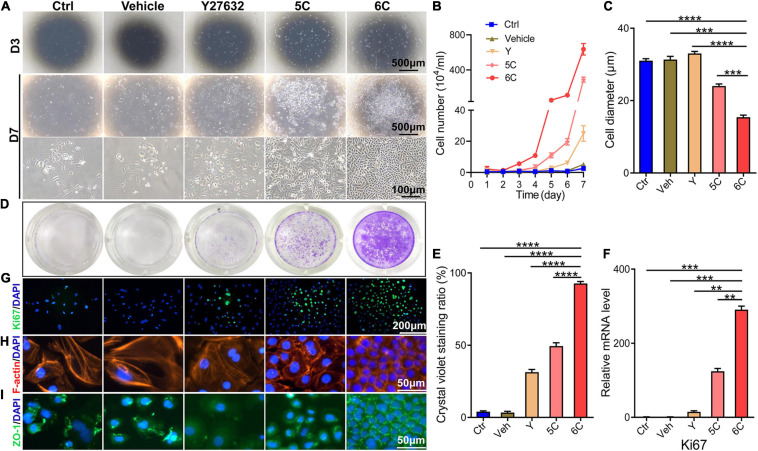
FIGURE 1.
6C can promote the proliferation of primary mCEC. (A) Morphological comparison of mCEC cultured with different compositions. Images were taken at day 3 and day 7 post seeding. (B) Cell growth curve. (C) A statistical graph of the average diameter of the cells after 1 week of culture. (D) Crystal violet staining results after 1 week of cell culture. 6C group had the most stained area. (E) Statistical analysis of crystal violet staining results after 1 week of cell culture. (n = 5 biological replicates). (F) qRT-PCR analysis of Ki67 gene expression (normalized to ctrl). (G) Ki67 (green) immunofluorescence staining. Nuclei were stained with DAPI (blue). (H,I) Immunofluorescence staining of F-actin (red) and ZO-1 (green). Nuclei were stained with DAPI (blue). The expression of F-actin and ZO-1 in 6C group was distributed on the cell membrane, and the connection between cells was tight, but the distribution of other treatment groups was scattered or missing. Data expressed as the means ± SEM from three separate experiments (**P < 0.01, ***P < 0.001, ****P < 0.0001).

