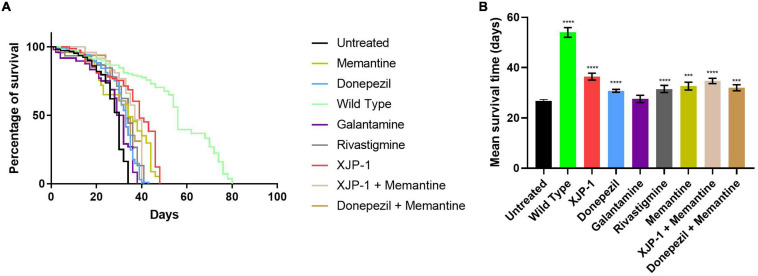
FIGURE 1.
Aβarc flies’ lifespan. (A) Kaplan–Meier survival trajectories of AβArc flies under different drug treatments. (B) Mean survival time of AβArc flies on different treatments. Kruskal–Wallis test followed by Dunn’s post hoc was used to compare the differences between different groups. Data are expressed as mean ± SEM, n = 3 (number of independent experiments with a minimum of 100 flies per genotype). P < 0.05 was considered as significant. *P < 0.05; **P < 0.01; ***P < 0.001; ****P < 0.0001. Genotypes: Untreated = Aβarc-expressing flies; Wild Type = elav-Gal4 line; all treated groups are Aβarc-expressing flies fed with the stated drug.

