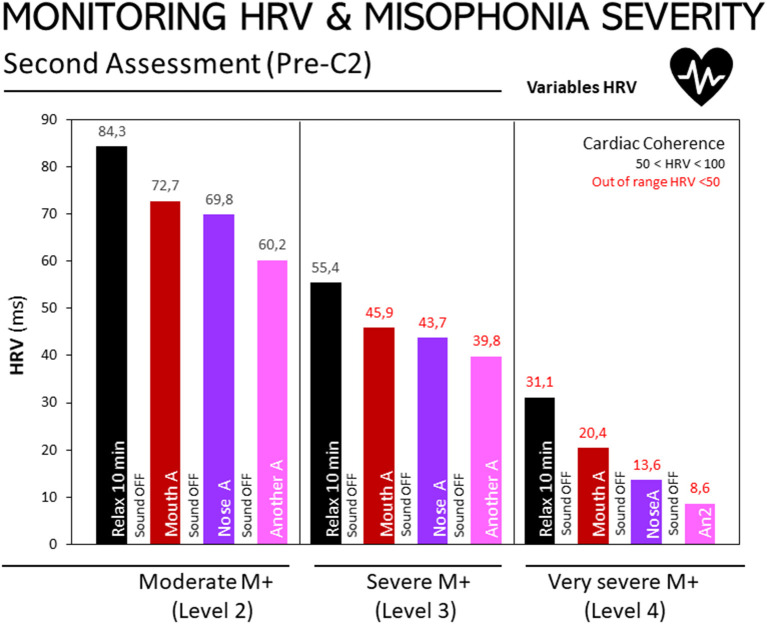
Figure 2.
Monitoring of HRV in people with misophonia during the second assessment, according to the severity of the disorder. Results are expressed as medians of HRV (ms). The 25, 50, and 75th percentiles are detailed in the Supplementary Table in Supplementary Material. Bar codes as in Figure 1. Moderate M+ (Level 2, n = 10), severe M+ (Level 3, n = 10), and extreme M+ (Level 4, n = 4) exposed to non-triggering auditory stimuli (mouth, nose, other). Misophonia was assessed using the Amsterdam Misophonia Scale [A-MISO-S, (41)] and the levels of misophonia were adapted by the authors for the only purpose to facilitate analysis in the present work.

