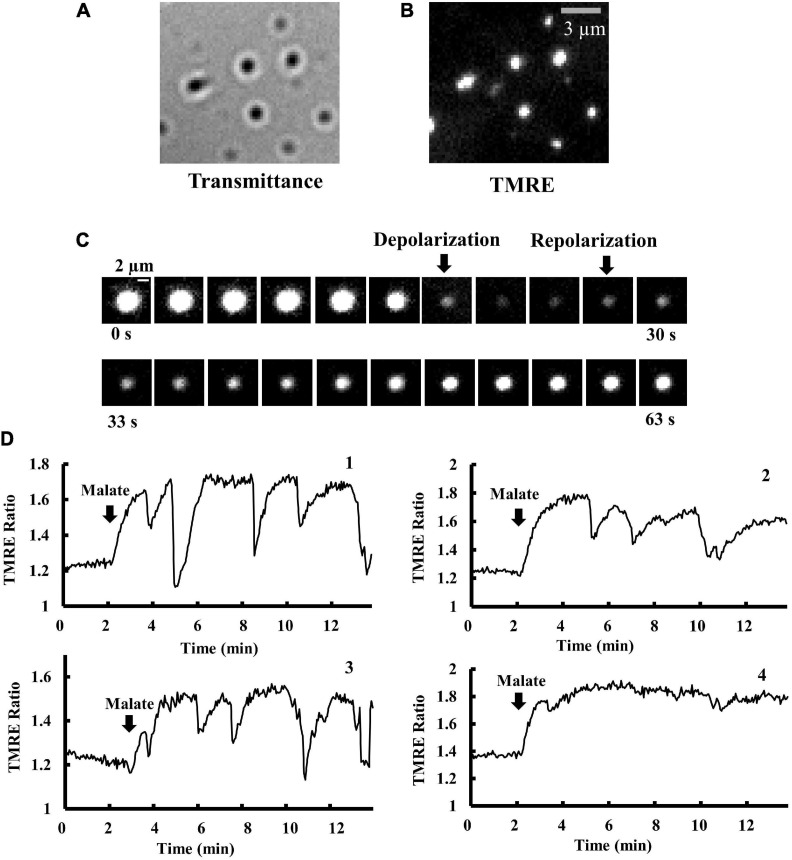
FIGURE 1.
Time course of changes in Δψm in isolated mitochondria. (A,B) Optical images of isolated mitochondria adsorbed on a cover slip. (A) Brightfield and (B) fluorescence images of the same microscopic field as (A). Bar, 3 μm. (C) Time-resolved fluorescence images of TMRE in a single mitochondrion. TMRE fluorescence was monitored in the presence of malate (5 mM). The arrows show the onset of depolarization and polarization. The time interval between images is 3 s. Bar, 2 μm. (D) Membrane potential (Δψm) in a single mitochondrion in response to malate addition. The vertical axis represents the fluorescence intensity of TMRE in a single mitochondrion, normalized by TMRE fluorescence in the buffer (TMRE Ratio). At t = 2 min, 5 mM malate was added. The fluctuations of Δψm significantly depend on individual mitochondria. Δψm in mitochondria 1–3 is fluctuating, but not in mitochondrion 4.

