
Figure 3.
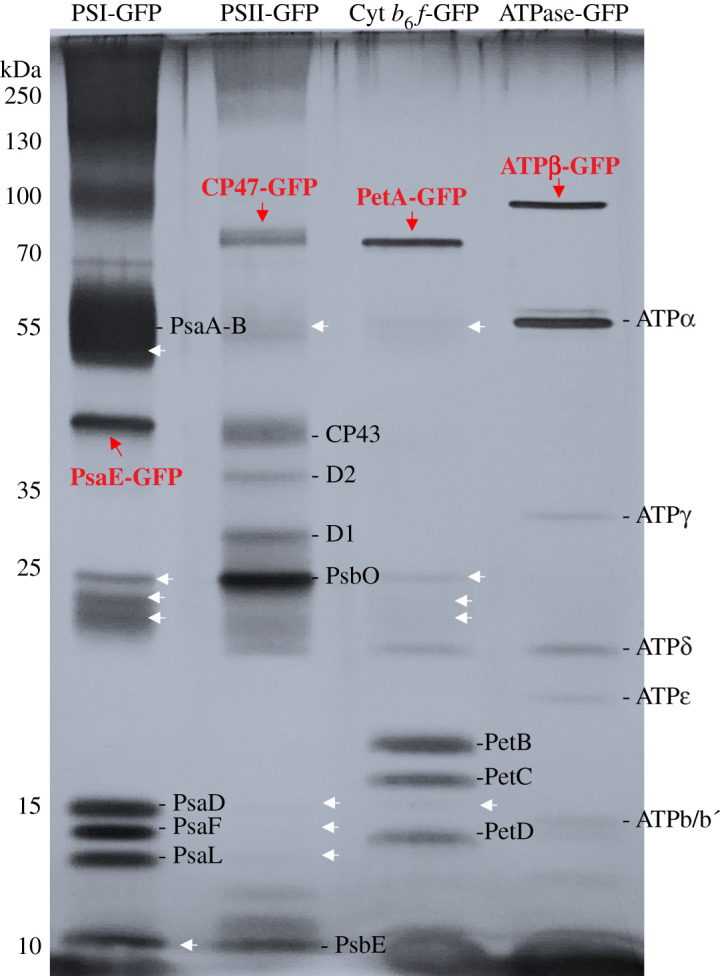
SDS-PAGE analysis of the pull-down samples, revealing the subunit composition of GFP-tagged protein complexes and interacting proteins. Black lines indicate the designated subunits in individual complexes. Red arrows indicate the corresponding subunits tagged with GFP in individual complexes. White arrows indicate the potential interacting proteins to the corresponding GFP-tagged complexes.