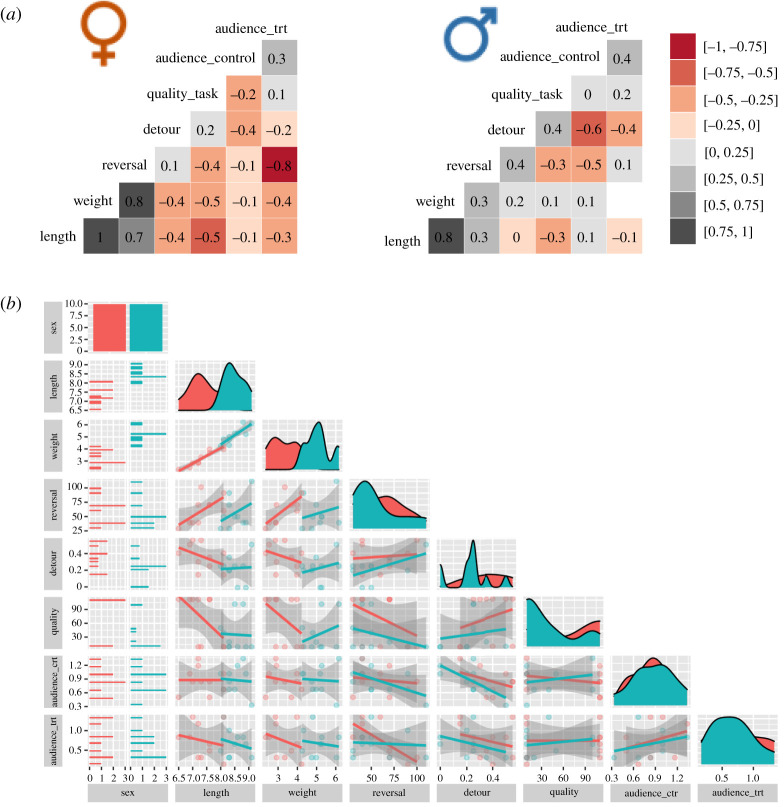
Figure 5.
Correlation matrices of body measurements and performance in 10 male and 10 female cleaner fish. (a) Spearman correlation coefficients (meaningful coefficient for small sample size was set at r ≥ 0.7). (b) Complementary visualization of data distribution and linear regressions of the variables from (a). ‘Length’ refers to body total length in cm; ‘weight’ is body mass in gram; ‘reversal’ is the number of trials needed to solve the reversal-learning task (i.e. low values means better performance); ‘detour’ is the proportion of correct detours; ‘quality’ task is the number of trials needed to solve the ‘client quality’ task (i.e. low values means better performance); ‘audience_ ctr’ indicates the flake to prawn ratio eaten by cleaners in the control condition of the audience effect task; ‘audience_trt’ indicates the flake to prawn ratio eaten by cleaners in the treatment condition of the audience effect task.

