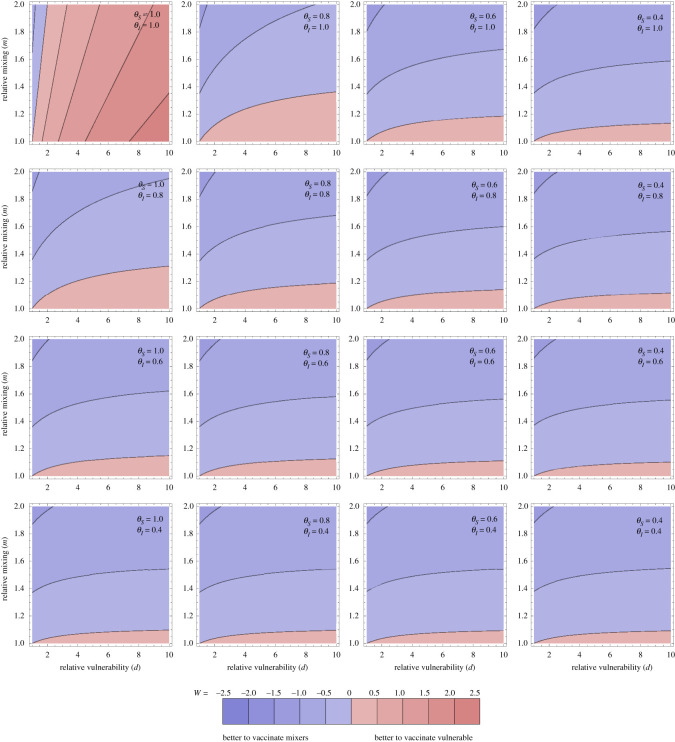
Figure 2.
Optimal allocation for averting disease. Optimal allocation for averting disease (as measured by W: logged ratio of disease averted by vaccinating the vulnerable compared with the mixers). Individual panels explore the population parameters (vulnerability d and mixing m on horizontal and vertical axes). The contour values are kept fixed between the plots, with the contour for ratio 1 between the blue and red, and meeting the bottom left of every panel (where m = d = 1 so the population is homogeneous). More disease is averted by vaccinating the vulnerable than the mixers in the pink regions and vice versa in the blue regions. Different panels vary the effects of the vaccine: the rows step through θI = 1, 0.8, 0.6, 0.4 and the columns step through θS = 1, 0.8, 0.6, 0.4. Through all panels, θD = 0.3. Thus the top left panel corresponds to the vaccine having no transmission-blocking effects at all, and stepping right and down increases transmission-blocking through reduced susceptibility or infectivity. ε = 0.1. All other parameters are as in figure 1.

