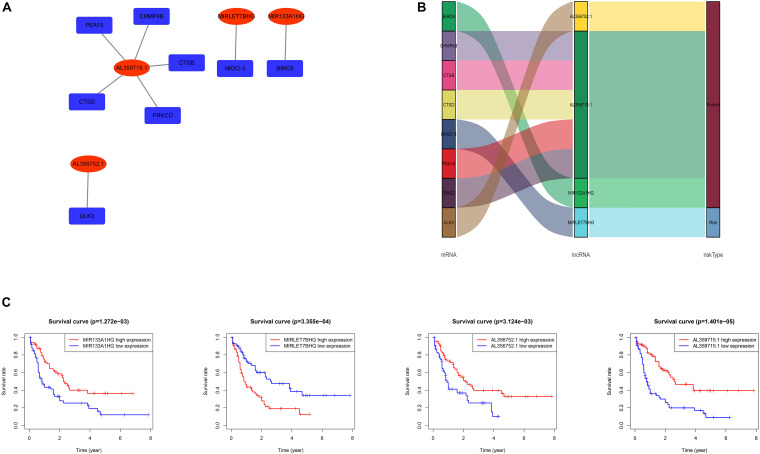
FIGURE 1.
(A) Network of the four lncRNAs with co-expressed autophagy-related genes in AML. The red nodes represent the lncRNAs and the deep blue nodes represent the autophagy-related genes. (B) The Sankey diagram shows the correlation between autophagy-related genes, autophagy-related lncRNAs and the risk type. The left box represents the autophagy-related genes, the middle box represents the lncRNA, and the right box represents the risk type (favorable/unfavorable). (C) Kaplan–Meier survival curves for the four lncRNAs in AML.

