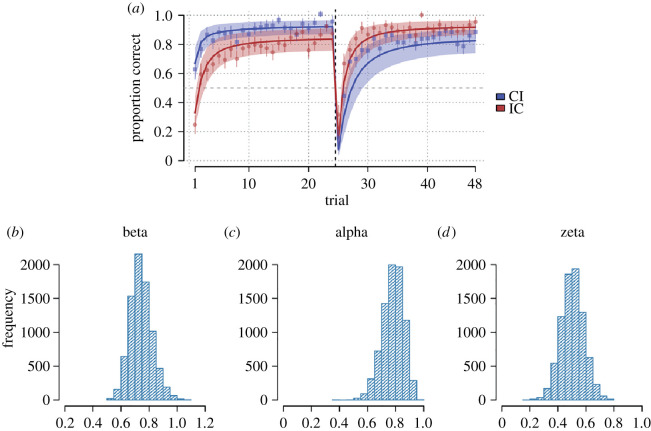
Figure 8.
(a) Posterior predictions from reinforcement learning model using the full posterior (8000 samples) from each participant's parameter fits each simulated 100 times. Thick line shows the predictions average over participants and shaded region the average of each participant's 80% predictive interval. Points represent average participant data and error bars represent standard errors. Blue colour indicates trials where participants faced the target interactant to whom congruent responses were required in the first half of the experiment and incongruent responses in the second half (CI, congruent to incongruent), and red colour indicates the target interactant to which the opposite response pattern was appropriate (IC, incongruent to congruent). (b–d) Histograms showing posterior distributions for the estimated population average temperature (β), learning rate (α) and copy-bias (ζ).

