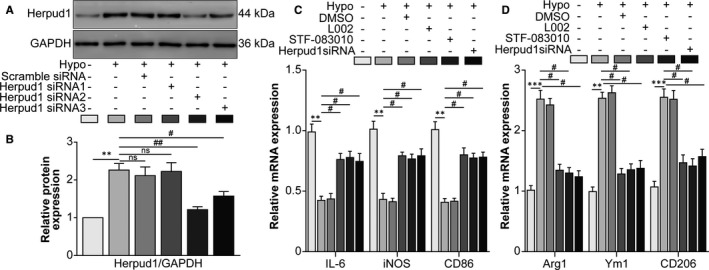
FIGURE 4.

The hypoxia‐induced p300/XBP1s/Herpud1 axis facilitated RAW264.7 cell M2 polarization. A, Western blot was performed to detect Herpud1 protein levels in the normal, scrambled siRNA and Herpud1 siRNA transfection groups. B, Densitometric quantification showed the ratio of Herpud1 protein to GAPDH protein. ** P <.01 vs the normal group; # P <.05, ## P <.01 vs the hypoxia group. NS indicates no significant difference vs the hypoxia group. RAW264.7 cells were assigned to normal, hypoxia, hypoxia +0.1% DMSO, hypoxia +L002, hypoxia +STF‐083010 and hypoxia +Herpud1 siRNA groups. C, The mRNA levels of the M1‐type macrophage markers IL‐6, iNOS and CD86 were detected by qRT‐PCR. ** P <.01 vs the normal group; # P <.05 vs the hypoxia group. D, The mRNA levels of the M2‐type macrophage markers Arg1 Ym1 and CD206 were detected by qRT‐PCR. ** P <.01, *** P <.005 vs the normal group; # P <.05 vs the hypoxia group. n = 4/group
