FIGURE 6.

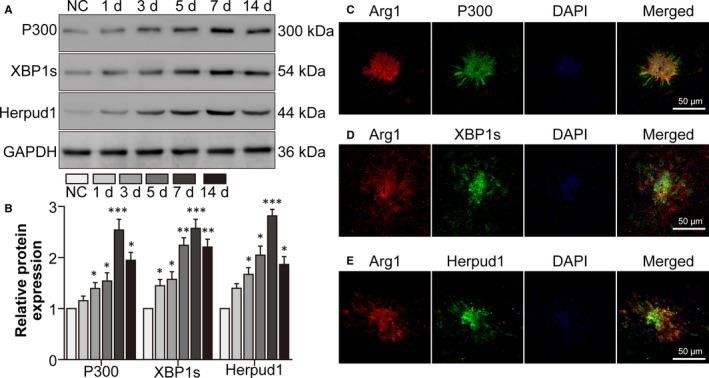
The P300/XBP1s/Herpud1 axis increased in infiltrating M2‐type macrophages in mouse CNV lesions. The mice were assigned to the normal control (NC), CNV 1 day, CNV 3 days, CNV 5 days, CNV 7 days and CNV 14 days groups. A, Western blot was performed to detect p300, XBP1s and Herpud1 protein levels in the mouse retina‐RPE‐choroid complexes. B, The relative protein levels of each molecule were analysed. * P <.05, ** P <.01, *** P <.005 vs the NC group. The mice were assigned into the NC and CNV 7 days groups. C, Double staining for Arg1 and p300 was performed with retina‐RPE‐choroid cryosections. D, Double staining for Arg1 and XBP1s was performed with retina‐RPE‐choroid cryosections. E, Double staining for Arg1 and Herpud1 was performed with retina‐RPE‐choroid cryosections. Scale bar =50 μm in Fig. 6C‐E. n = 4/group
