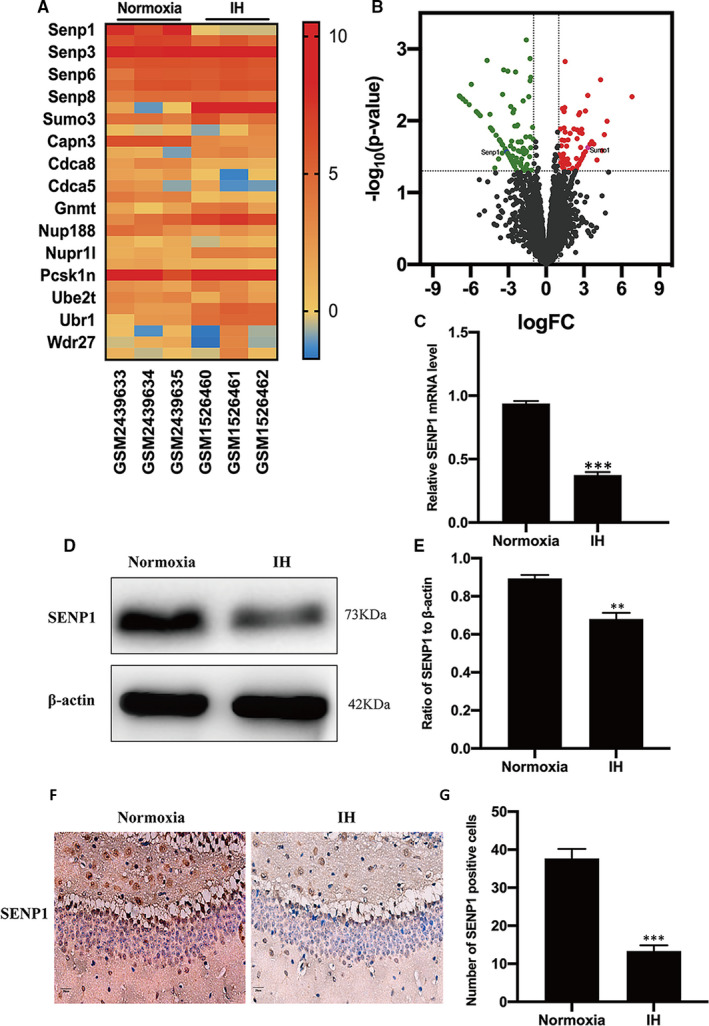
FIGURE 1.

SENP1 is down‐regulated in the hippocampus of mice with intermittent hypoxia (IH) treatment. (A) Heat map of mRNA showing the differences in SENP1 expression between the normoxia and IH groups. ‘Red’ indicates up‐regulation and ‘Blue’ indicates down‐regulation. (B) Volcano map of differentially expressed genes in hippocampus. The abscissa represents log [fold‐change (FC)], and the ordinate represents log10 (p value). ‘Red’ dots represent up‐regulated genes, whereas ‘green’ dots represent down‐regulated genes in the hippocampus of mice with IH treatment. (C) qRT‐PCR, (D, E) Western blot analysis and (F, G) immunohistochemical assay showed the differences in the expressions of SENP1 between the normoxia and IH groups. n = 3 per group. ** P < .01, *** P < .001 versus the normoxia group. Scale bar = 20 μm. SENP1, small ubiquitin‐related modifier protein‐specific protease 1; qRT‐PCR, quantitative reverse transcriptase polymerase chain reaction; Normoxia: mice were treated under normoxia condition; IH: mice were treated under IH condition
