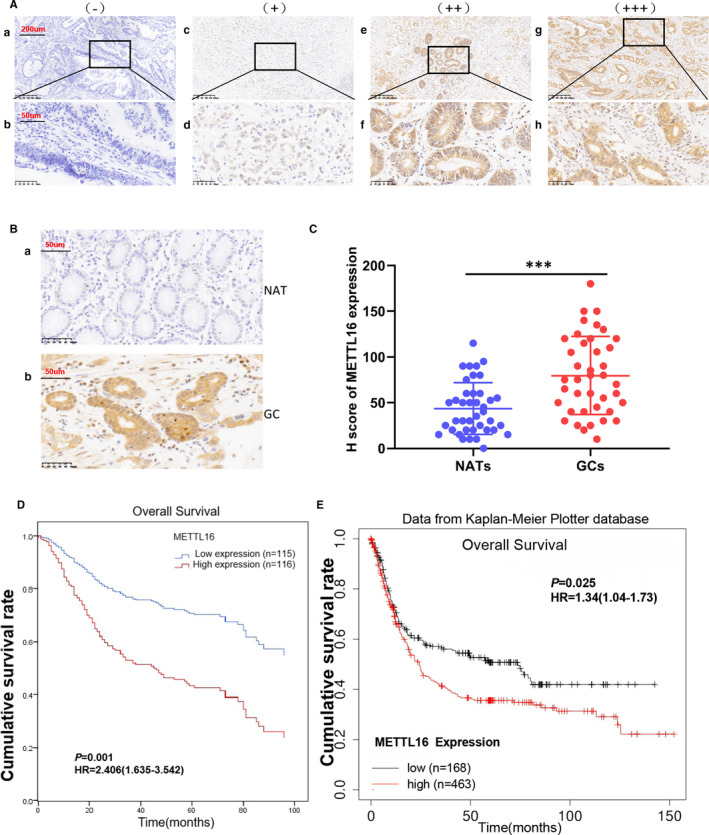
FIGURE 2.

High expression of METTL16 in GC is related to poor survival of patients. (A and B) Immunohistochemical staining of METTL16 in GC tissues and paired normal adjacent tissues. (A) Representative image of GC tissues with negative (A and B), weak positive (C and D), moderately positive (E and F) and strong positive (g and h) METTL16 expression. The images are magnified 100X (A, C, E and G) and 400X (B, D, F and H). (B) Representative image of METTL16 staining in GC tissues and the paired normal adjacent tissues (NAT) (magnified 400X). (C) H score of METTL16 staining in GC tissue and the paired normal adjacent tissues (n = 40, H score 43.63 ± 28.41 vs 79.65 ± 42.80,***P ﹤ .001 compared with paired normal adjacent tissues).(D) COX regression model for multivariate analysis showed that the expression level of METTL16 was significantly negatively correlated with the overall survival rate in 231 GC patients (log‐ranch test). (E) The expression level of METTL16 in GC patients was significantly negatively correlated with the overall survival rate in the Kaplan‐Meier plotter database (238931_at)
