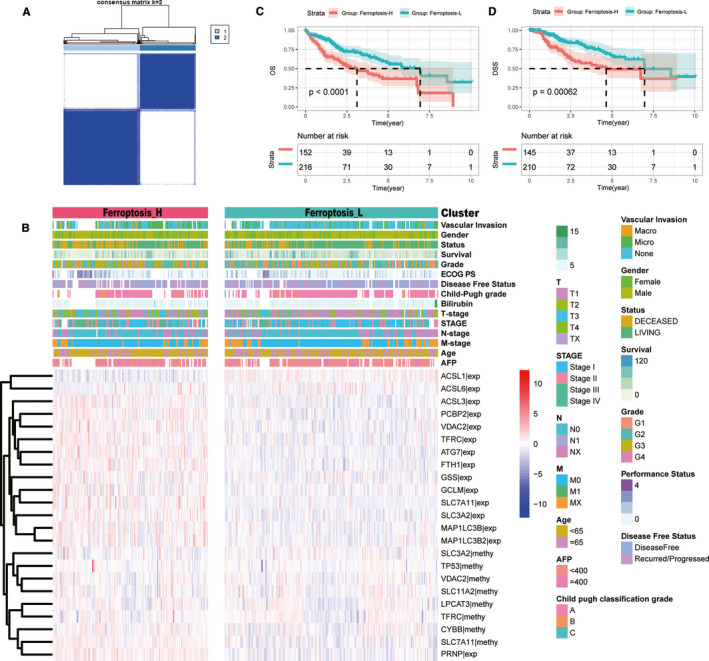
FIGURE 1.

The landscape of ferroptosis‐related HCC subgroups in the TCGA cohort. (A) Two ferroptosis subgroups were generated via unsupervised consensus clustering. (B) Heatmaps of two ferroptosis‐related subgroups in the TCGA cohort. 15 mRNA expression level and 8 methylation level which were highly related to the prognosis of patients with HCC and used for clustering were illustrated. Clinicopathology characteristics were correspondingly listed. (C‐D) The survival time curve of two ferroptosis‐related subgroups. Ferroptosis‐H group had a worse OS (C) and DSS (D) than the Ferroptosis‐L group
