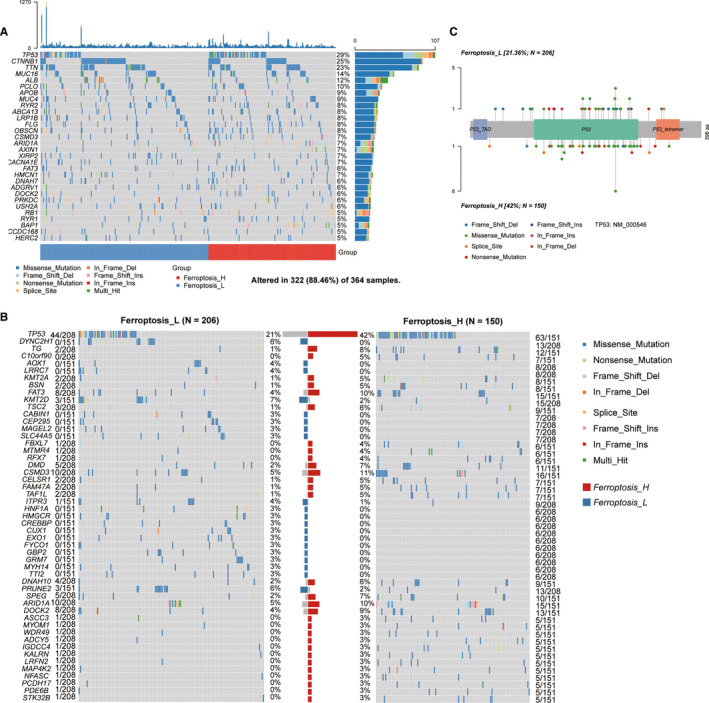
FIGURE 3.

The mutation signature profile of HCC. The plots showed the TMB landscape in patients with HCC (A) and the correlation between these mutations (B). (C) Genes with the significantly differentially mutational burden in different ferroptosis‐related subgroup were showed by the waterfall plot, the central bar plot summarized the proportion of TMB of each gene in two different groups. (D) The lollipop plot of TP53 gene showed the exact mutational position with type and its frequency
