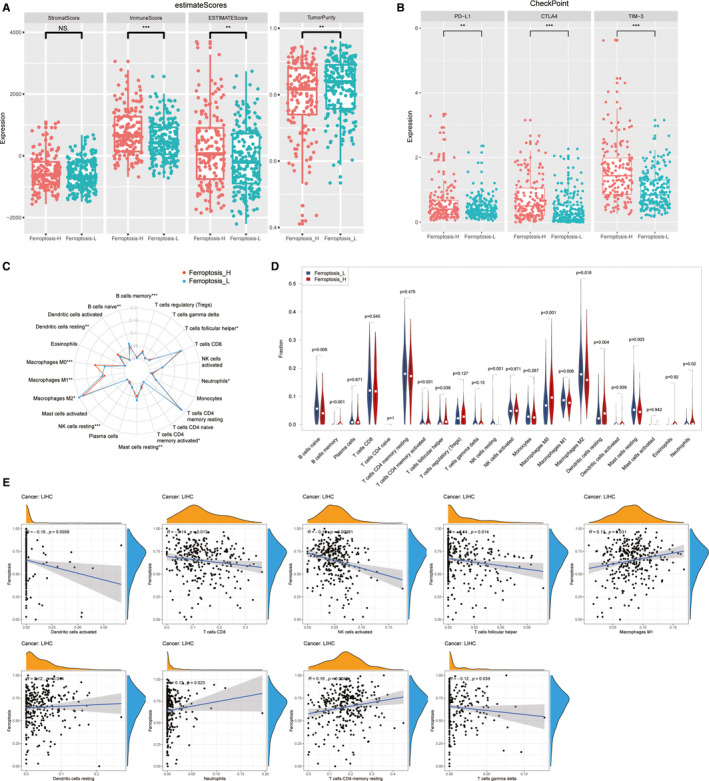
FIGURE 4.

The immune landscape of two ferroptosis‐related subgroups. The ESTIMATE score (A) and immune checkpoints‐related gene expression (B) of two different ferroptosis phenotype groups. The proportional differences of 22 kinds of immune cells between patients with HCC were showed by radar plot (C) and violin plot (D). Scatter plots showed the significant correlation of tumour‐infiltrating immune cells proportion with ferroptosis score calculated by ssGSEA (P < .05) (E)
