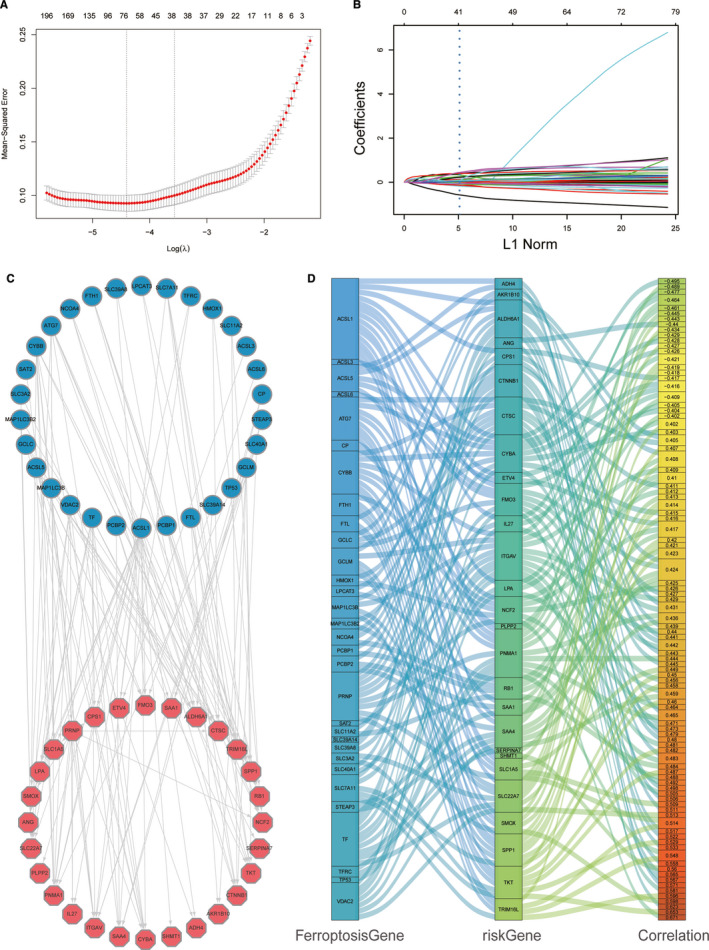
FIGURE 5.

Identification of ferroptosis‐related risk gene and relationship with ferroptosis‐related gene. (A) Selecting the key differentially expressed genes related to the two ferroptosis subgroups in the LASSO model (λ). (B) LASSO coefficient spectrum of 508 genes enrolled and generate a coefficient distribution map for a logarithmic (λ) sequence. (C)The plot showed a significant correlation (P < .001) of the ferroptosis gene (left part) and risk gene (right part) with a correlation index higher than 0.3. (D) Sankey plot of significant correlation index ferroptosis gene (first column) and risk gene (second column) higher than 0.4 (P < .001)
