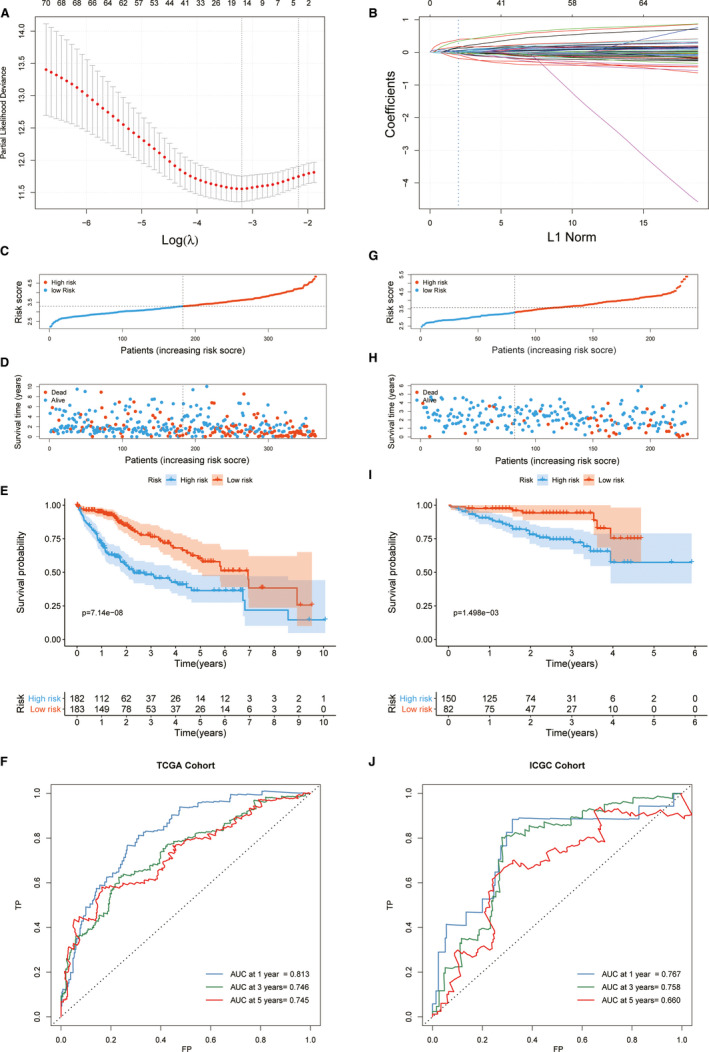
FIGURE 6.

Construction and validation of FPM. (A) Selecting the best parameters for FPM in the LASSO model (λ). (B) LASSO coefficient spectrum of 84 genes enrolled and generate a coefficient distribution map for a logarithmic (λ) sequence. In the TCGA cohort, the FPM risk score of each patient was plotted and the high‐risk and low‐risk group were divided using median cut‐off value (C). The distribution of survival state (D), survival curve (E) and ROC curve (F) for the high‐risk and low‐risk group in the TCGA cohort were showed. The same cut‐off value of the FPM risk score was deployed in the ICGC cohort for risk stratification (G), and the survival state (H), survival curve (I) and ROC curve (J) of the high‐risk and low‐risk group in the ICGC cohort were showed
