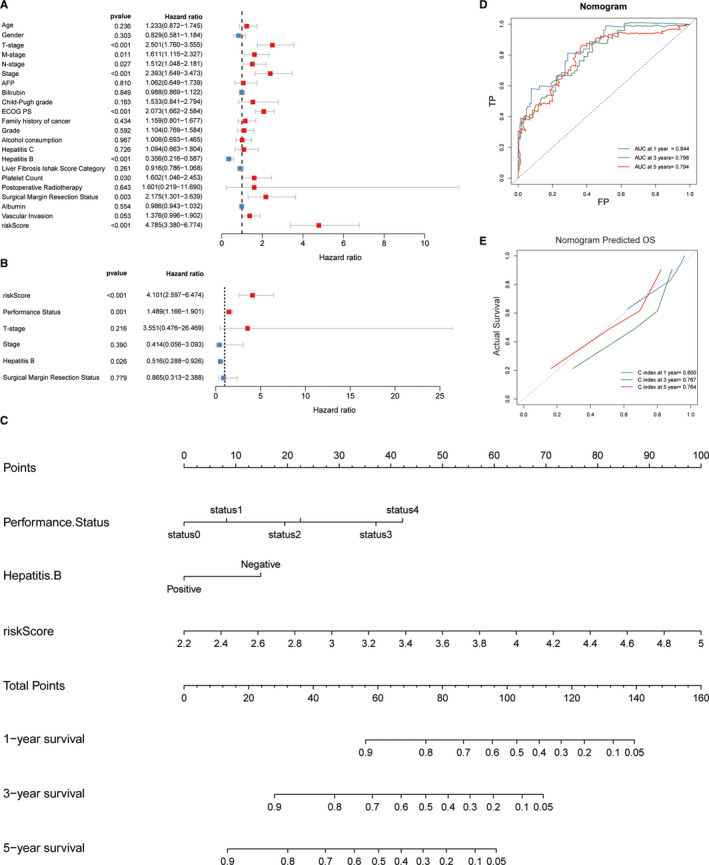
FIGURE 7.

Establishment and assessment of the nomogram. Univariate (A) and multivariate (B) Cox regression analysis of the relationship between the FPM and clinicopathological characteristics regarding OS. (C) Nomogram constructed combined with ECOG PS and FPM. ROC (D) and calibration curve (E) of the nomogram for predicting the probability of 1‐, 3‐ and 5 years OS in the TCGA cohort
