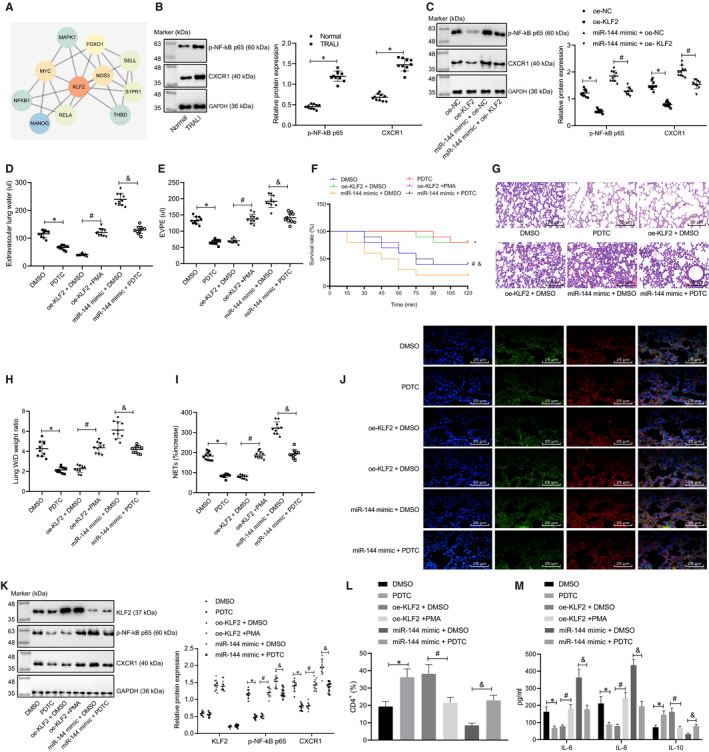
FIGURE 5.

miR‐144 inhibits KLF2 to activate the NF‐κB/CXCR1 signalling pathway, thereby aggravating NET‐induced TRALI. A, A PPI network diagram of KLF2 and its related genes constructed by the online analysis tool String. The deeper red colour of the circle indicates the higher core degree, while the deeper blue colour indicates the lower core degree. B, The extent of NF‐κB p65 phosphorylation and CXCR1 protein level normalized to GAPDH in neutrophils of normal and TRALI mice evaluated by Western blot analysis. C, The extent of NF‐κB p65 phosphorylation and CXCR1 protein level normalized to GAPDH in neutrophils of TRALI mice treated with oe‐KLF2, miR‐144 mimic or oe‐KLF2 + miR‐144 mimic evaluated by Western blot analysis. TRALI mice were then treated with DMSO, PDTC, oe‐KLF2 + DMSO, oe‐KLF2 + PMA, miR‐144 mimic +DMSO or miR‐144 mimic +PDTC. D, EVLW of TRALI mice in each group. E, EVPEs of TRALI mice in each group. F, Survival rate of TRALI mice in each group within 2 h. G, Lung injury identified by HE staining (×200). H, Lung W/D ratios. I, The formation of NET in the blood of TRALI mice in each group detected by MPO‐DNA ELISA. J, The NET network structure of the lung tissues of TRALI mice in each group measured by immunofluorescence staining (×400). K, The extent of NF‐κB p65 phosphorylation and protein expression levels of KLF2 and CXCR1 normalized to GAPDH in neutrophils of TRALI mice in each group tested by Western blot analysis. L, Flow cytometry to detect the proportion of CD4+ cells in BALF. M, ELISA to measure levels of IL‐6, IL‐8 and IL‐10 in BALF. The measurement data were expressed by the mean ±standard deviation. The experiment was repeated 3 times independently. The data comparison between the two groups was conducted by an unpaired t test. The data comparison among multiple groups was performed using a one‐way ANOVA, followed by Tukey's post hoc test. Kaplan‐Meier method was used to calculate the survival rate of mice, and a log‐rank test was used to test the difference regarding survival. * P < .05 vs. normal mice, oe‐NC‐ or DMSO‐treated mice with TRALI. # P < .05 vs. miR‐144 mimic +oe‐NC‐ or oe‐KLF2 + DMSO‐treated mice with TRALI. & P < .05 vs. miR‐144 mimic +DMSO‐treated mice with TRALI. n = 10
