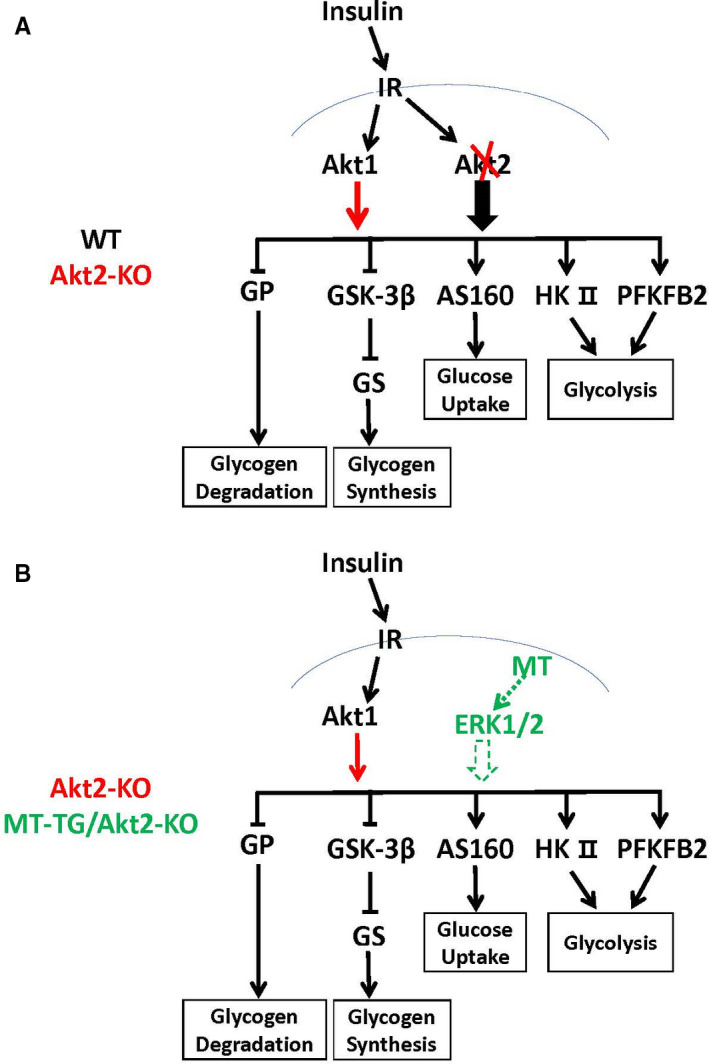
FIGURE 8.

Schematic illustration of the assumed mechanisms by which the minimal glucose metabolism is compensated by up‐regulated Akt1 in the heart of Akt2‐KO mice (a) and the normal glucose metabolism is preserved by overexpressed cardiac MT in the heart of Akt2‐KO mice (b). Red line indicates the compensative changes related to glucose metabolism in the heart of Akt2‐KO mice compared to WT mice. Green lines indicate the changes related to glucose metabolism preserved by overexpressed cardiac MT in the heart of MT‐TG/Akt2‐KO mice compared to Akt2‐KO mice. Thicker arrows indicate more impact on the targets. Dashed line presents the possible pathways. IR, insulin receptor
