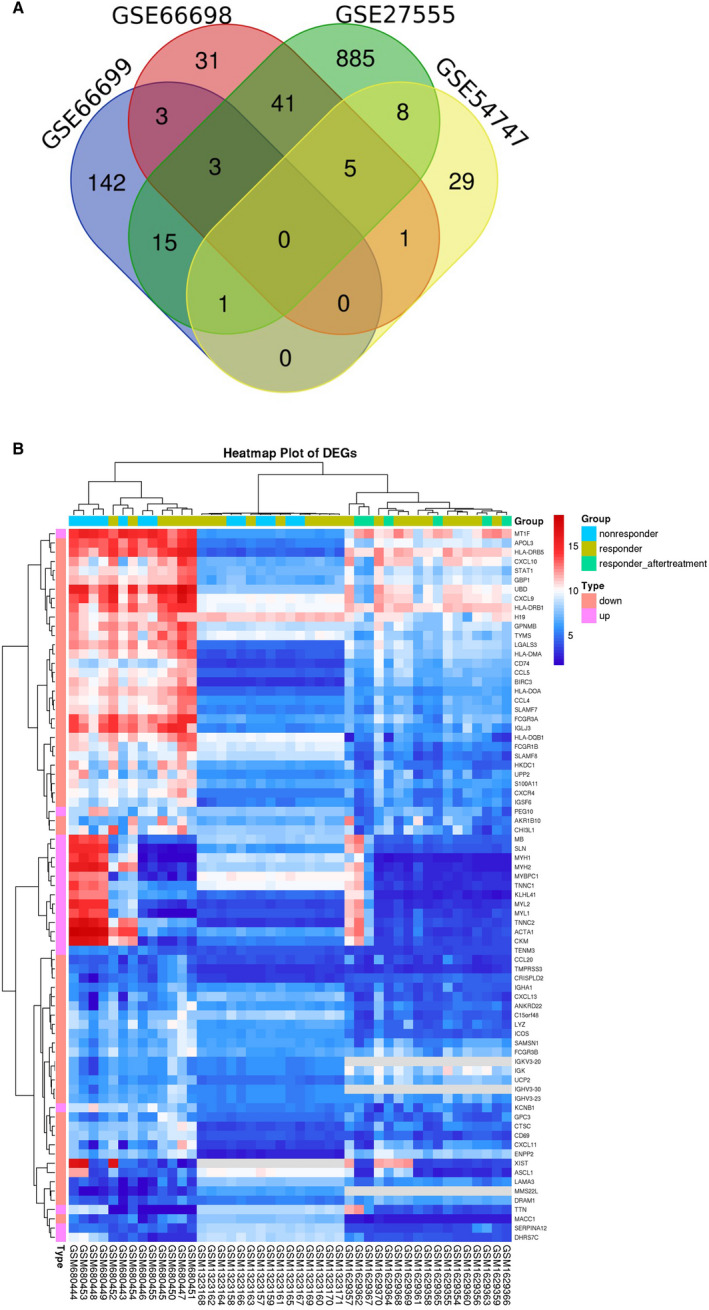
FIGURE 1.

A, Venn diagram: differential expressed genes (DEGs) were selected with a fold change >1 and P‐value <0.05 among the mRNA expression profiling sets GSE66698, GSE66699, GSE54747 and GSE27555. The 4 data sets showed an overlap of 77 DEGs. B, Heat map of the selected 77 DEGs:blue indicates a relatively low expression, and red indicates a relatively high expression
