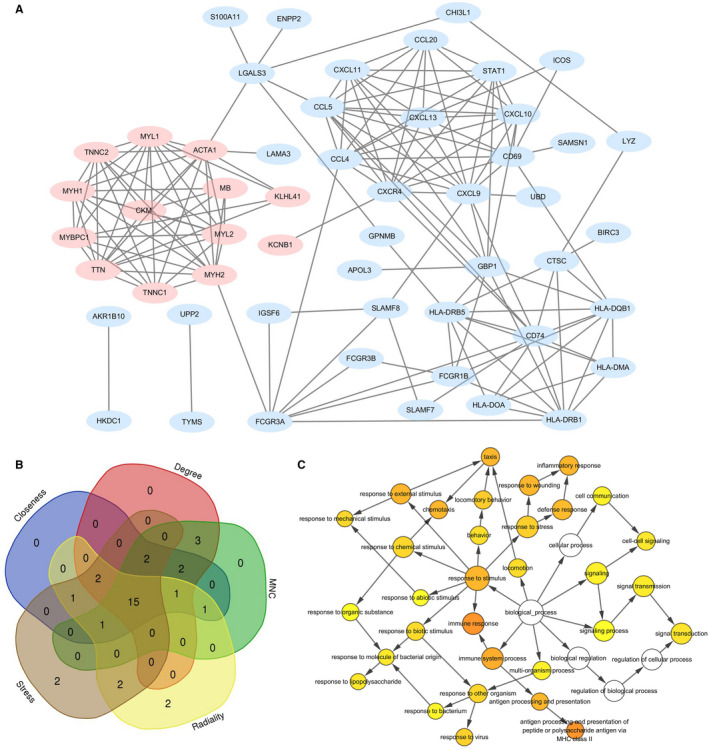
FIGURE 3.

A, The protein‐protein interaction(PPI) network of the differentially expressed genes (DEGs) was constructed using Cytoscape. B, Overlapping the first 25 genes in the five classification methods of cytoHubba to identify hub genes. C, The biological process(BP) analysis of hub genes was constructed using BiNGO. The colour depth of nodes refers to the corrected P‐value of ontologies. The size of nodes refers to the numbers of genes that are involved in the ontologies. P <.01 was considered statistically significant
