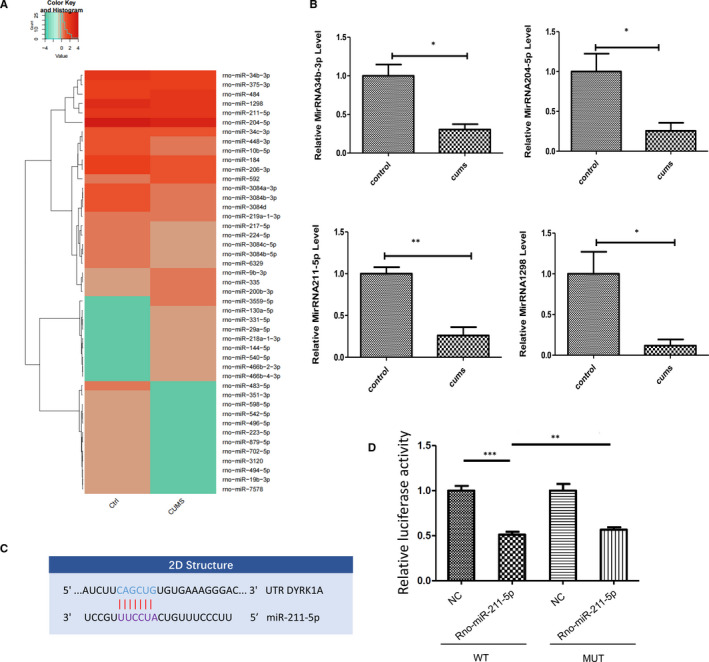
FIGURE 1.

MiRNA expression profiles of CA1 tissue and validation of target genes of miR‐211‐5p. A, Heatmap diagram of differential miRNA expression levels by sequencing on the Illumina HiSeq 2500 platform. B, Quantitative real‐time PCR was used to validate expressions of miR‐211‐5p, miR‐1298, miR‐204‐5p and miR‐34b‐3p. N = 6 per group. Data are presented as the means ± SEMs. *P < .05, **P < .01. C, Putative seed‐matching sites between miR‐211‐5p and DYRK1A. (D) Luciferase reporter assay was used to detect relative luciferase activities of WT and MUT DYRK1A reporters. (**P < .01; **P < .01)
