
FIGURE 3.
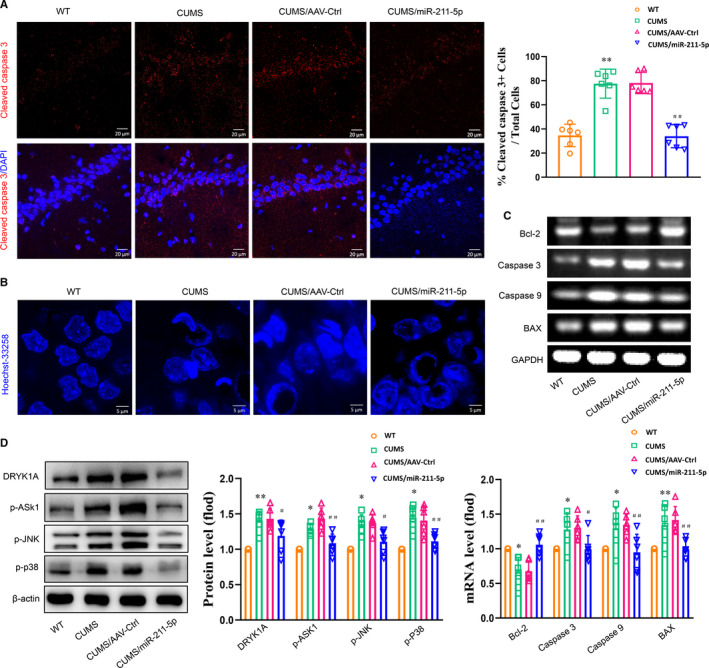
Up‐regulation of miR‐211‐5p decreased neuronal apoptosis in CUMS rats. A, Representative confocal microscopic images showing positive cells labelled with cleaved caspase 3 within the CA1 region. Scale bar is 20 µm. B, Representative images of Hoechst‐33258 staining to observe morphological changes in nuclei. Scale bar is 5 µm. C, mRNA expression levels of Bcl2, Bax, cleaved caspase 3 and caspase 9 within the CA1 region. (D) Up‐regulation of miR‐211‐5p decreased Dyrk1A expression and phosphorylated levels of ASK1, JNK and p38 within the CA1 region. N = 6 per group. Data are presented as the means ± SEMs. *P < .05, **P < .01 vs. wild type; # P < .05, ## P < .01 vs. AAV‐control (CUMS+AAV‐Ctrl). WT, wide type