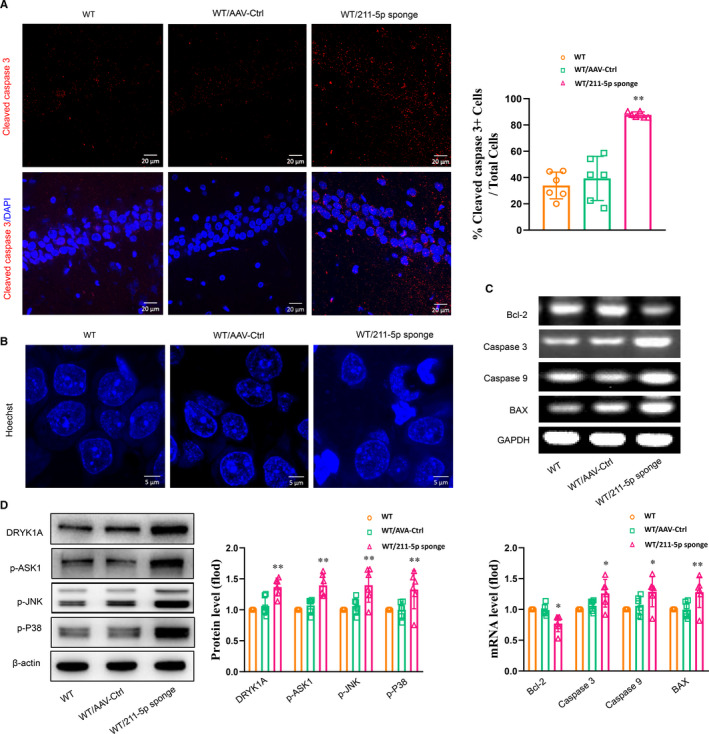
FIGURE 5.

Knock‐down of miR‐211‐5p within the CA1 region in normal rats increased neuronal apoptosis. A, Representative images of cleaved caspase 3–positive cells within the CA1 region. Scale bar is 20 µm. B, Representative images of Hoechst‐33258 staining in nuclei. Scale bar is 5 µm. C, mRNA levels of apoptotic‐related factors within the CA1 region. D, Knock‐down of miR‐211‐5p increased Dyrk1A expression and phosphorylated levels of ASK1, JNK and p38 within the CA1 region. N = 6 per group. Data are presented as the means ± SEMs. *P < .05, **P < .01 vs. WT/AAV‐control (WT+AAV‐control). WT, wide type; Ctrl, control
