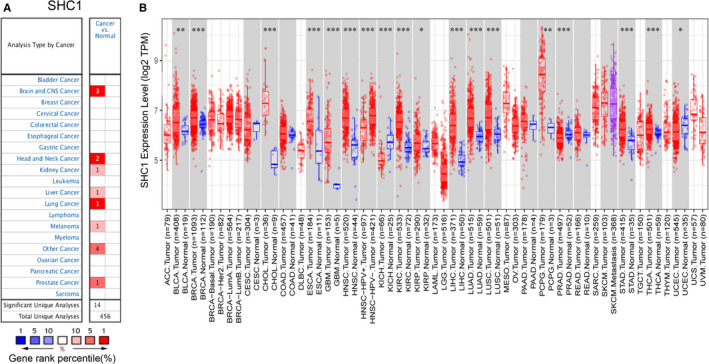
FIGURE 1.

SHC1 expression levels in different cancer types. A, The graph demonstrated the overexpression (red) or down‐regulation (blue) of SHC1 in different data sets (Cancer vs. Normal tissue). Cell colours indicated the best gene rank percentile for analyses. B, SHC1 expression levels in different types of human cancer and normal tissues from TCGA analysed by TIMER (*P < 0.05, **P < 0.01, ***P < 0.001). TCGA, The Cancer Genome Atlas; TIMER, Tumor Immune Estimation Resource
