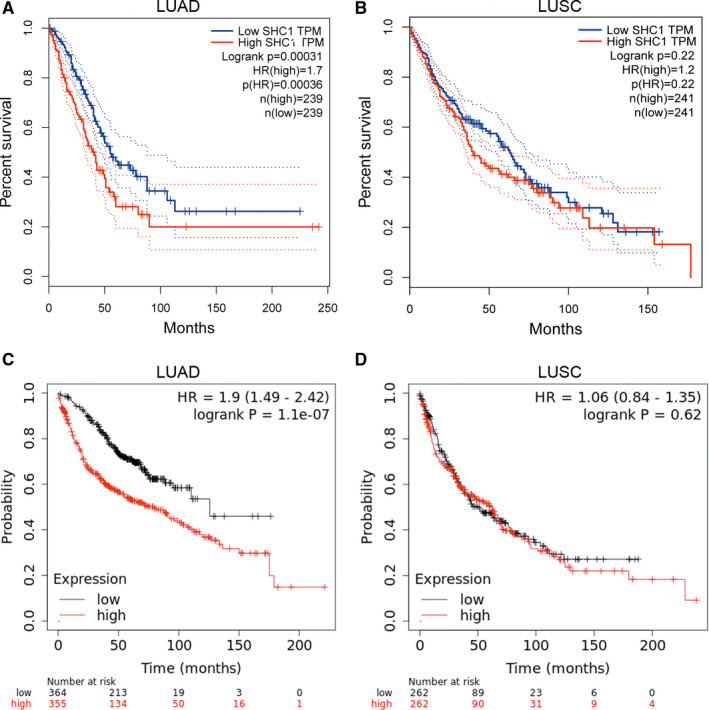
FIGURE 4.

Kaplan‐Meier curves for overall survival based on SHC1 expression levels of LUAD and LUSC patients in GEPIA2 and Kaplan‐Meier Plotter databases (A‐D). A‐B, Survival curves of LUAD and LUSC patients in GEPIA2 database (n = 478, n = 482, respectively). Overexpression of SHC1 predicted poorer OS in LUAD patients in GEPIA2 database (HR = 1.7, logrank P = 0.00031). C‐D, Survival curves of LUAD and LUSC patients in Kaplan‐Meier Plotter database (n = 719, n = 524, respectively). Overexpression of SHC1 predicted poorer OS in LUAD patients in KM Plotter database by using ‘201469_s_at’ affymetrix ID (HR = 1.9, logrank P = 0.01). GEPIA2, Gene Expression Profiling Interactive Analysis 2; OS, overall survival
