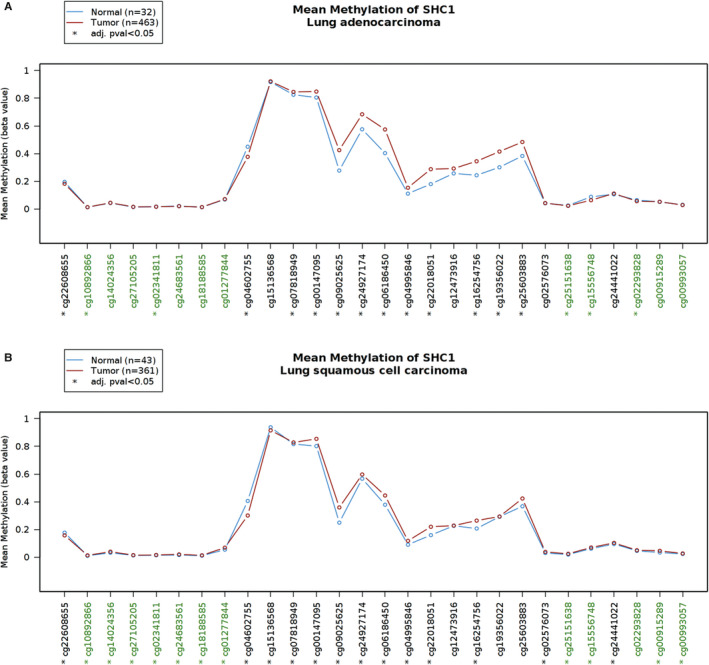
FIGURE 5.

Analysis of SHC1 methylation level at different probes in LUAD and LUSC datasets by using 450k methylation array in Wanderer database. The graph allowed the comparison of tumour and normal profiles. A, In LUAD data set, probe‐level analysis revealed 10 evident hypermethylated probes in SHC1 flanking regions in LUAD tissues (cg07818949, cg00147095, cg09025625, cg24927174, cg06186450, cg04995846, cg22018051, cg16254756, cg19356022, cg25603883, respectively); in SHC1 CpG island (green probes), 5 probes (cg10892866, cg02341811, cg25151638, cg15556748 and cg02293828) also showed differences in methylation level between LUAD tissues and normal tissues (*P < 0.05). B, In LUSC data set, probe‐level analysis identified nine evident hypermethylated sites in SHC1 flanking regions in LUSC tissues (cg07818949, cg00147095, cg09025625, cg24927174, cg06186450, cg04995846, cg22018051, cg16254756, cg02576073, respectively); in SHC1 CpG island (green probes), cg10892866, cg14024356, cg27105205, cg02341811, cg24683561, cg18188585, cg01277844, cg25251638, cg15556748, cg00915289 and cg00993057 showed differences in methylation level between LUSC tissues and normal tissues (*P < 0.05). The plot and P values were produced using Wanderer (http://maplab.imppc.org/wanderer/)
