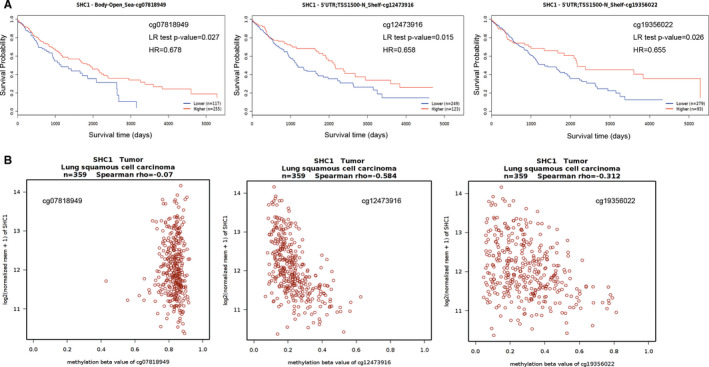
FIGURE 7.

Analysis of the relationships among SHC1 methylation levels at specific probes, survival time and SHC1 expression level in LUSC data set. A, Kaplan‐Meier plots containing the correlations between survival time and the methylation status of SHC1 at specific probes in LUSC data set. B, The correlation between SHC1 expression and the methylation status of SHC1 at specific probes in LUSC data set
