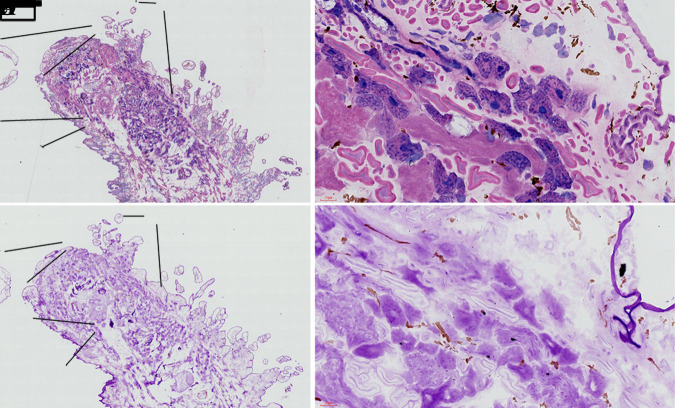
Fig. 6.
HE and PAS staining of frozen sections of O. jantseanus on the coronal plane. (A) HE staining. (B) PAS staining. (C) Close-up view of HE staining in the black frame of the image A. Dark blue acid cells (ac), red-stained collagen fibers (cf), and cuticle layer (cl). (D) Close-up view of PAS staining in the black frame of the image B. The darkest PAS staining was observed in the cuticle layer (cl), followed by acid cells (ac), and collagen fiber (cf). Scale bars: A and B, 500 µm; C and D, 50 µm.

