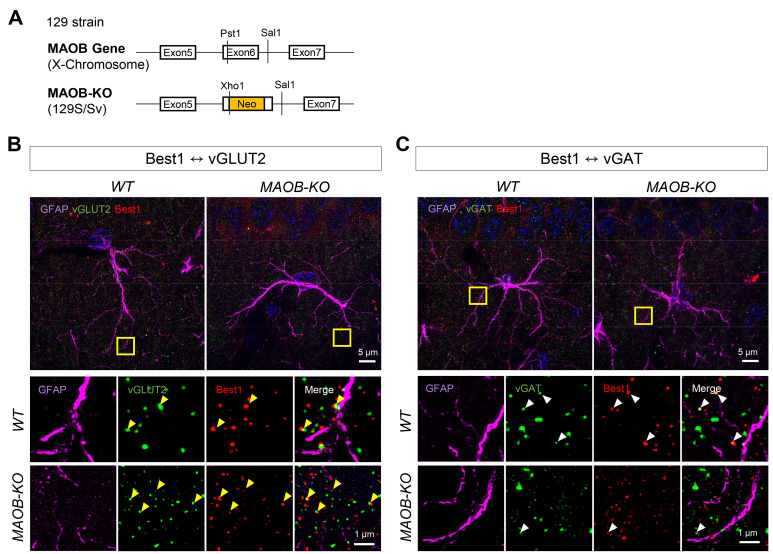
Fig. 3.
Comparison of distance from Best1 to vesicular transporters in CA1 of WT and MAOB-KO mouse brain. (A) Schematic diagram of MAOB-KO transgenic mice. (B) Representative images (upper panel, scale bar=5 μm) and the high magnification images (lower panel, scale bar=1 μm) of vGLUT2 (green), Best1 (red) and GFAP (magenta) in WT and MAOB-KO mice. Yellow arrowheads indicate overlapped vGLUT2 and Best1. (C) Representative images (upper panel, scale bar=5 μm) and the high magnification images (lower panel, scale bar=1 μm) of vGAT (green), Best1 (red) and GFAP (magenta) in WT and MAOB-KO mice. White arrowheads indicate overlapped vGAT and Best1.

