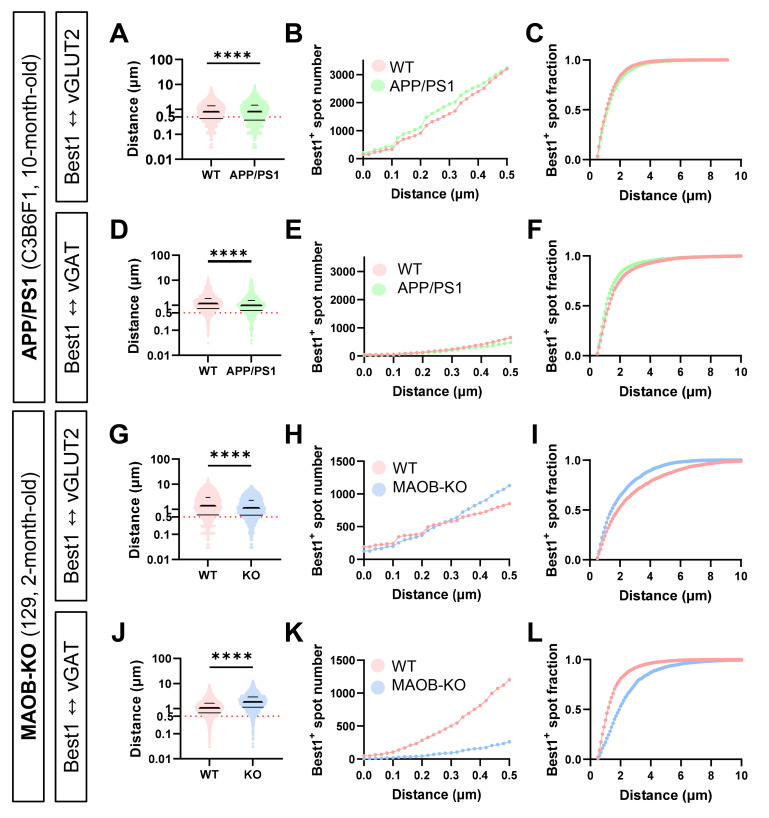
Fig. 4.
Differential proximity of perisynaptic astrocytic Best1 at the excitatory and inhibitory tripartite synapses in APP/PS1 and MAOB-KO mice. (A, D, G, J) Violin plot of all measured distance values. (B, E, H, K) Cumulative distribution plot of values under 500 nm. (C, F, I, L) Cumulative fraction of values over 500 nm. (A~C) Distance between Best1 and vGLUT2 in WT (pink) and APP/PS1 (green) mice. (D~F) Distance between Best1 and vGAT in WT (pink) and APP/PS1 (green) mice. (G~I) Distance between Best1 and vGLUT2 in WT (pink) and MAOB-KO (blue) mice. (J~L) Distance between Best1 and vGAT in WT (pink) and MAOB-KO (blue) mice.

