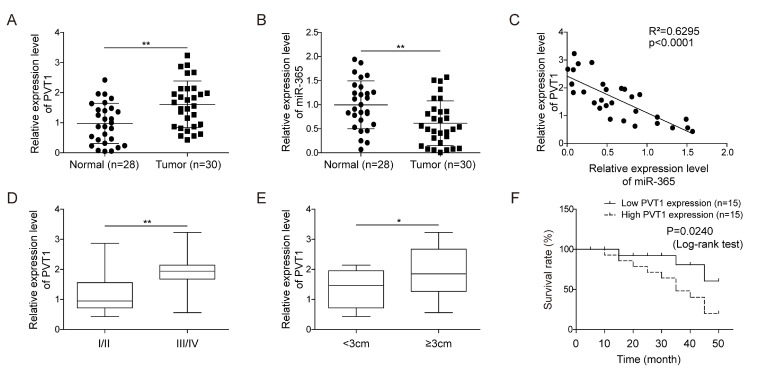
Fig. 1.
PVT1 was upregulated and miR-365 was downregulated in glioma tissues. (A) The levels of lncRNA PVT1, assessed by RT-qPCR, were higher in glioma tissue samples comparatively to normal brain tissue specimens. GAPDH was used for normalization. (B) The expression of miR-365 detected by RT-qPCR, was down-regulated in glioma tissue samples compared with normal tissues. U6 was used for normalization. (C) Pearson’s correlation test was used to verify correlations between PVT1 and miR-365, and analysis of the results revealed that expression of PVT1 was negtively correlated with miR-365 in glioma tissue samples. (D) PVT1 expression, assessed by RT-qPCR, was positively correlated with the WHO grade and tumor size. (F) Kaplan-Meier survival curves revealed that high expression of PVT1 was associated with poor survival in glioma patients. Data are presented as Mean±SD of three independent experiments. *p<0.05, **p<0.01.

