FIGURE 3.
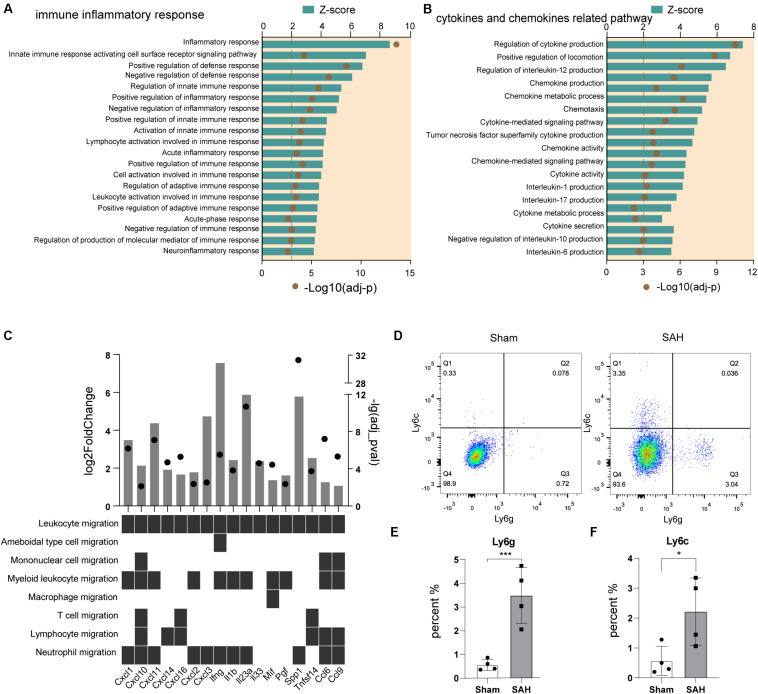
Immune response and chemotaxis term were activated in post-SAH microglia. (A) GO enrichment analysis was performed by Metascape on all DEGs in sham and SAH microglia. Shown are the z-scores of biological functions on inflammatory and immune response-related pathways. (B) Shown are the z-scores of biological functions on cytokine and chemokine-related pathways. (C) Expression profiles of DEGs (fold change > 2, adj_pval < 0.01) in SAH microglia related to leukocyte recruitment pathways. (D–F) Flow cytometric analysis showed that the number of Ly6c+ and Ly6g+ cells increased after SAH, n = 4 per mice group. DEG, differentially expressed gene. *P < 0.05, ***P < 0.001.

