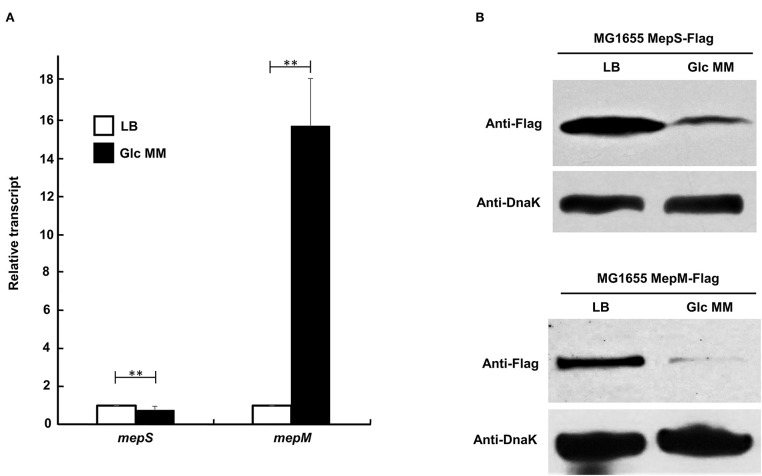
Figure 2.
Changes in mRNA and protein levels of MepS and MepM in LB and M9 minimal media. (A) Transcript levels of the mepS and mepM genes in LB (white bars) and M9 minimal media (black bars). mRNA was extracted from MG1655 cells grown in the LB or M9 minimal medium containing 0.2% glucose to early exponential phase (OD600nm = 0.4). Data were obtained from three independent experiments. mRNA levels were normalized to the concentration of 16S rRNA. **p < 0.01 (B) Protein levels of MepS and MepM in the LB or M9 minimal medium. Western blot analysis with anti-Flag and anti-DnaK antibodies was performed using 5 x 10⁷ cells in MG1655 MepS-Flag or 5 x 10⁸ cells in MG1655 MepM-Flag, grown in the LB or M9 minimal medium containing 0.2% glucose (Glc MM) to the early exponential phase (OD600nm = 0.4). DnaK was used as the loading control.

