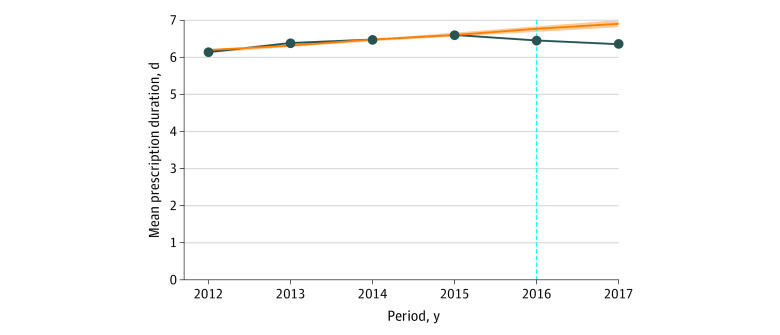
Figure 2. Mean Initial Prescription Duration Among Patients Who Were Opioid Naive Receiving Any Opioid Prescription vs Projections From Preguideline Trend .
The vertical blue line indicates the 2016 release of the Centers for Disease Control and Prevention’s “Guideline for Prescribing Opioids for Chronic Pain”10; orange line, projected opioid prescription duration based on linear projections from preguideline trend; shading, 95% CI; dark blue line, observed opioid prescription duration.

