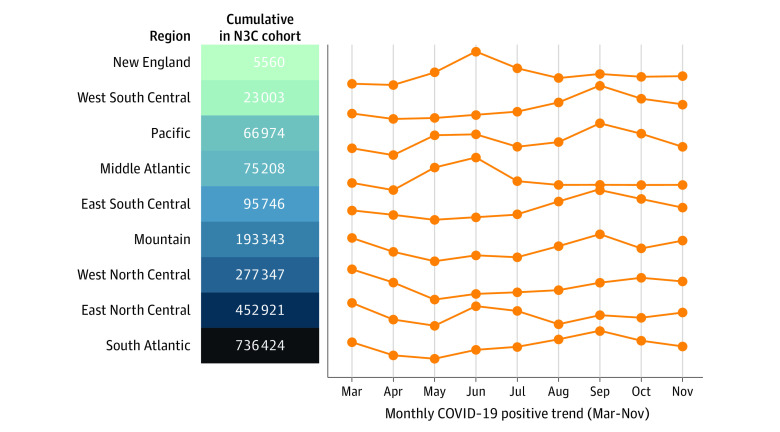
Figure 1. Geographic Distribution of Overall SARS-CoV-2–Positive Patients in the US National COVID Cohort Collaborative (N3C) Cohort (N = 1 926 526).
Trend lines show the accumulation of each subregion’s sample size of laboratory-confirmed positive cases in 2020. The Southeast, Middle Atlantic, and Midwestern regions are the most heavily represented, but all regions have substantial patient counts.

